Predicting Pitcher Injuries Before They Happen
A Data-Driven Approach to Protecting Your Most Valuable Assets
Every MLB team knows the sinking feeling: a star pitcher grabs his elbow mid-game, and suddenly a $200 million investment walks off the mound toward months of rehabilitation. What if you could see it coming?
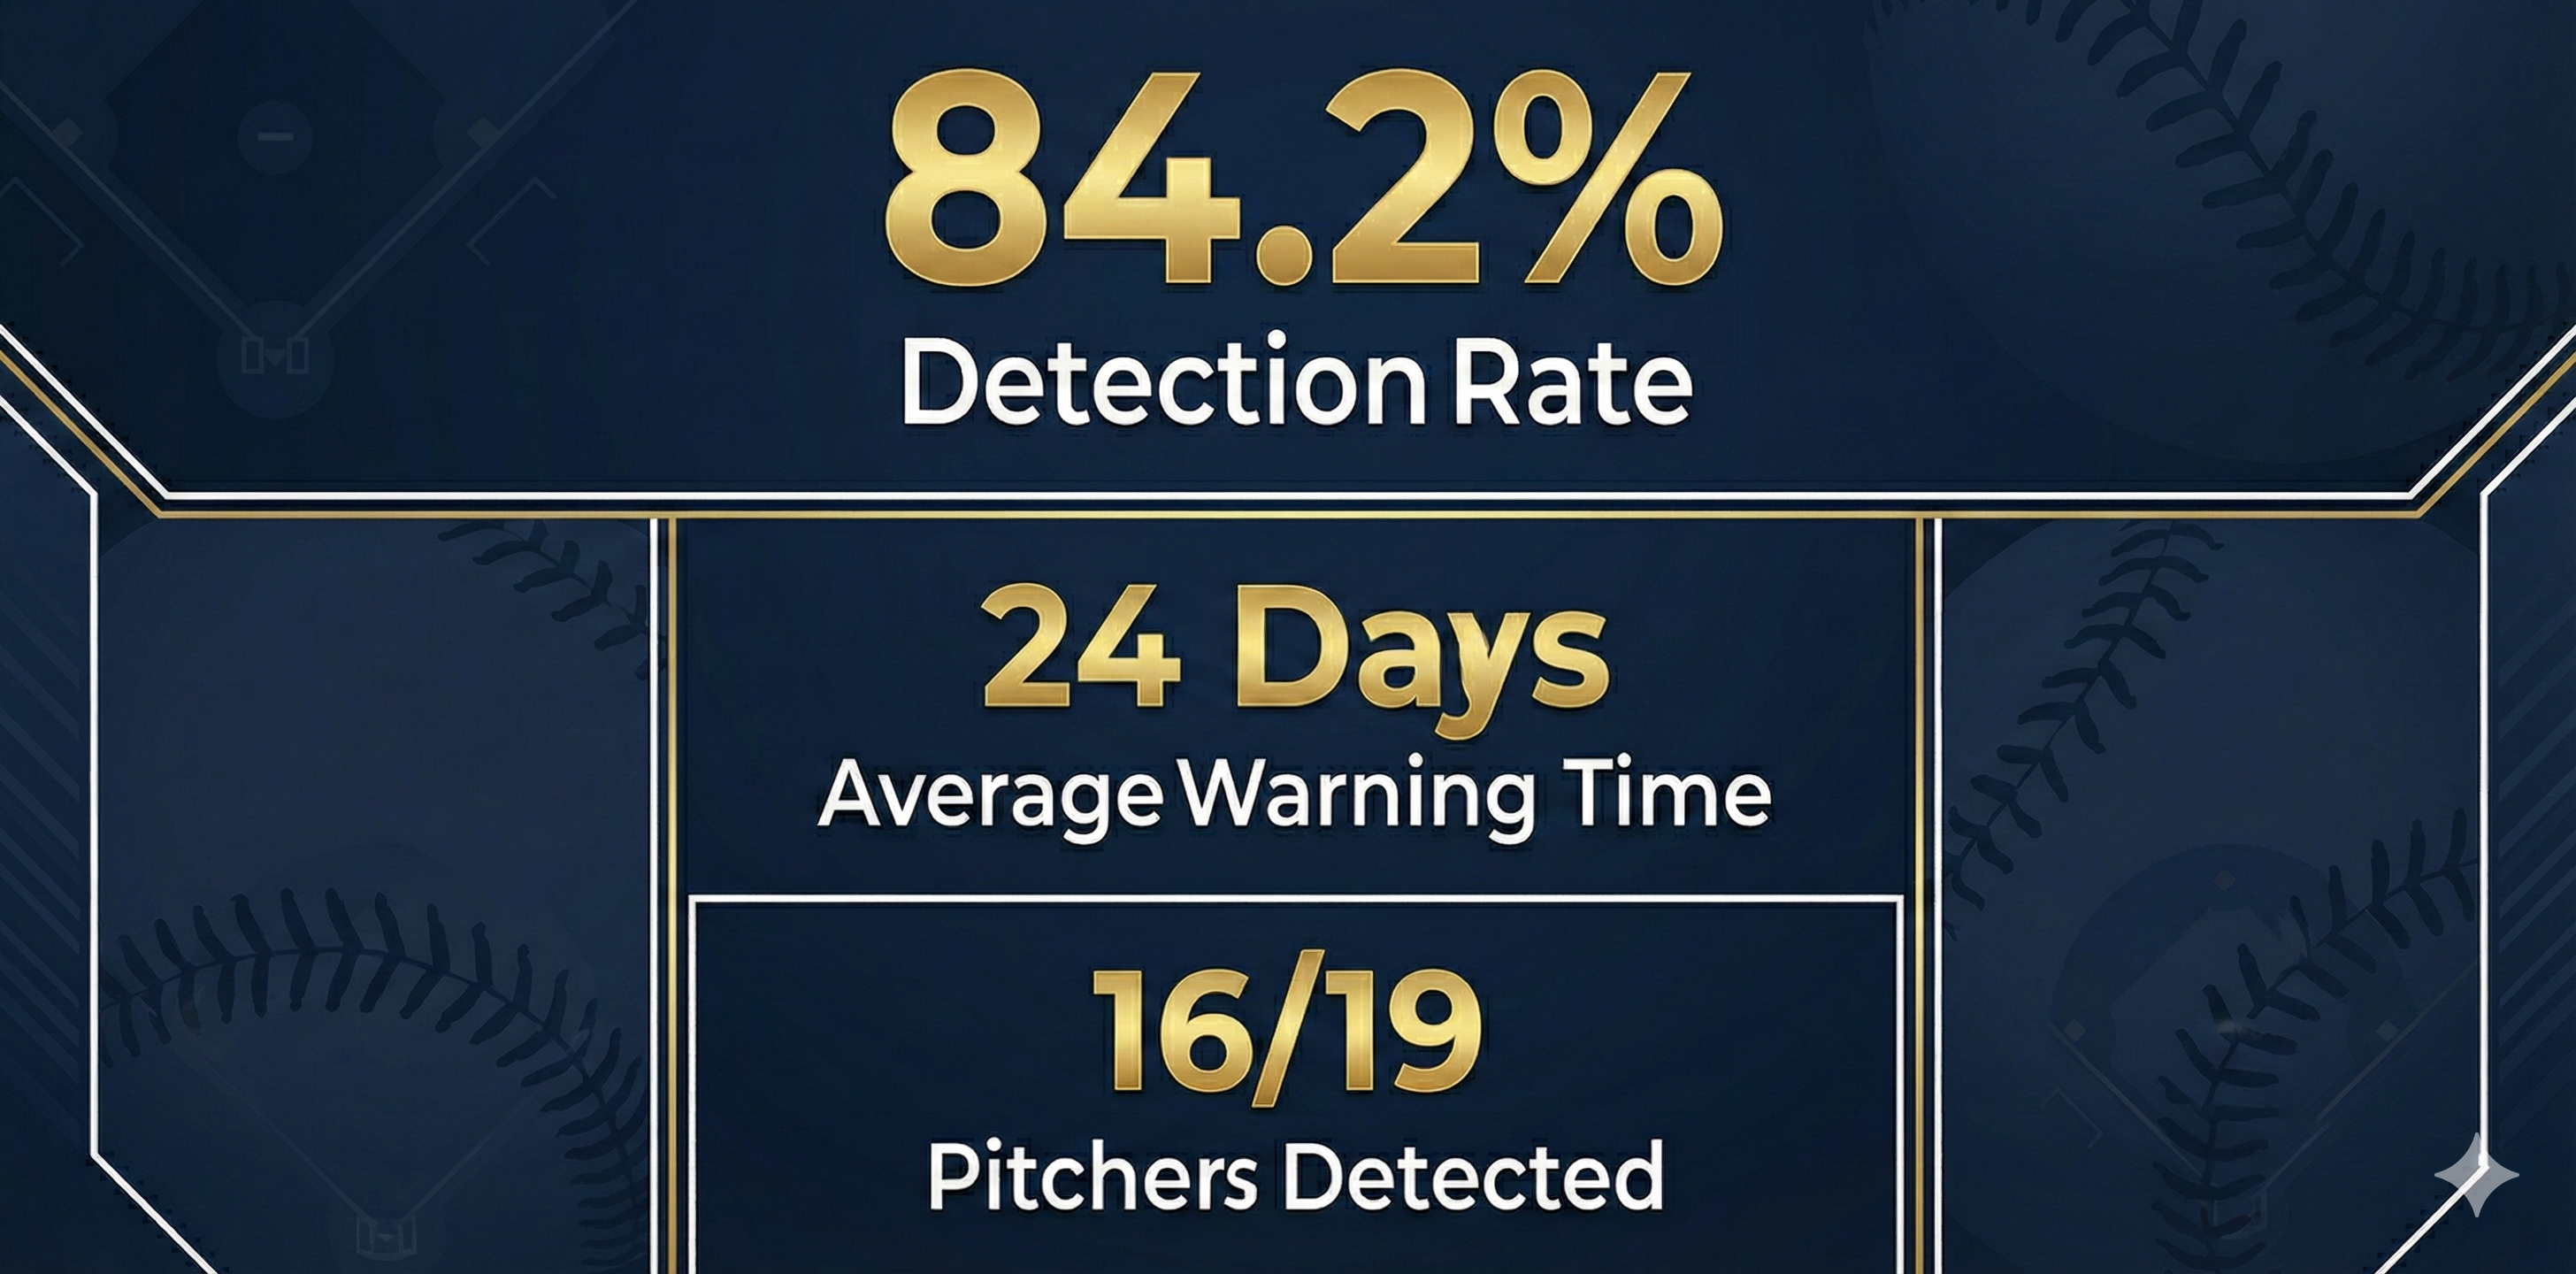
Triaxis AI detected pre-injury anomalies in 16 of 19 pitchers with available data
Baseball's Most Expensive Guessing Game
In 2025 alone, MLB teams have lost $710 million to injuries, with arm injuries accounting for $347 million - nearly half of all financial losses. Starting pitchers represent the largest share at over $343 million in lost value.
Current Prevention Methods Fall Short
Watch the Explainer
A brief walkthrough of this pitcher injury detection research
The Body Tells the Truth
When a pitcher's arm is developing an injury, the body compensates - often before the pitcher consciously feels anything wrong. These compensations show up as subtle changes.
Velocity Patterns
Small but consistent changes in throwing speed
Release Point
Where the ball leaves their hand shifts
Arm Extension
How far they reach toward home plate
Pitch Selection
Unconsciously favoring pitches that hurt less
Our hypothesis: By analyzing every pitch a player throws and comparing it to their personal baseline, we can detect these compensations weeks before they become injuries.
Detection Performance
Among 19 Detectable Cases
*5 pitchers excluded due to insufficient pre-injury data (60+ day gaps)
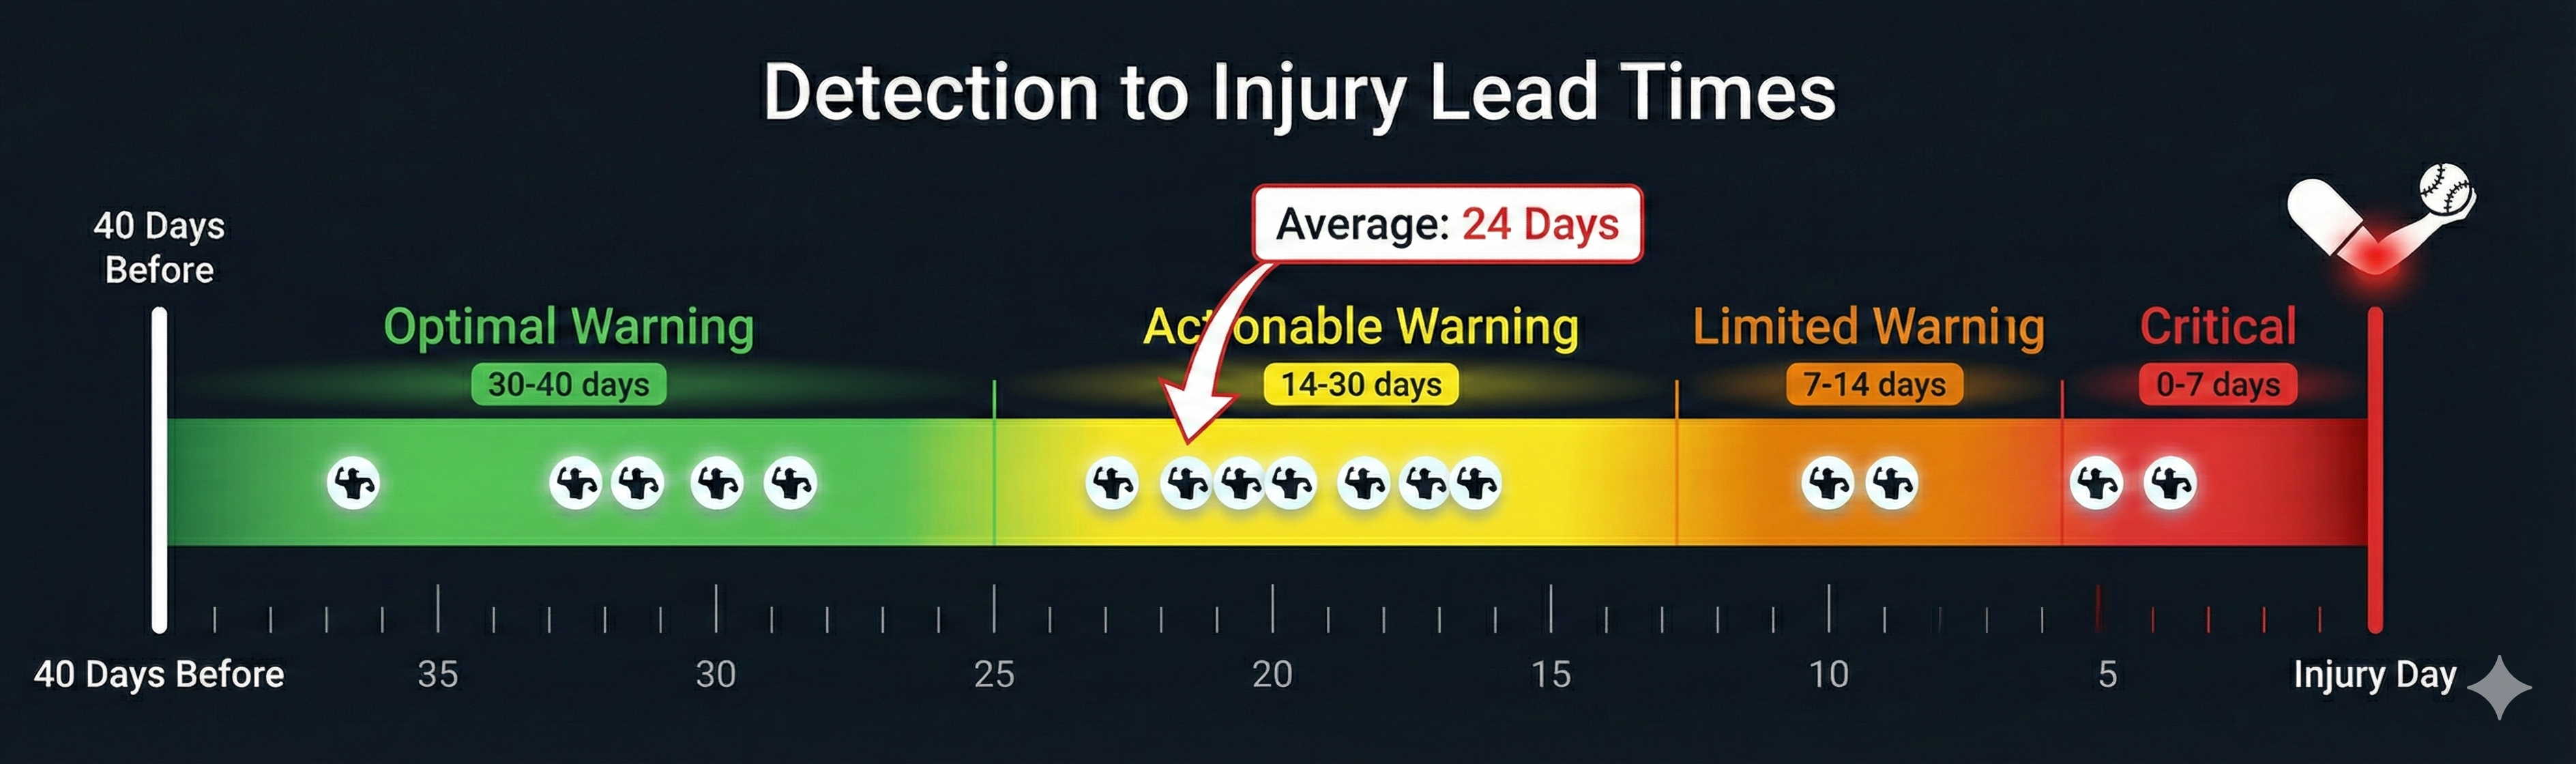
Warning Time Distribution
The Velocity Signal
Changes in average velocity are the strongest predictor of impending injury - appearing 3x more often in pre-injury signals.
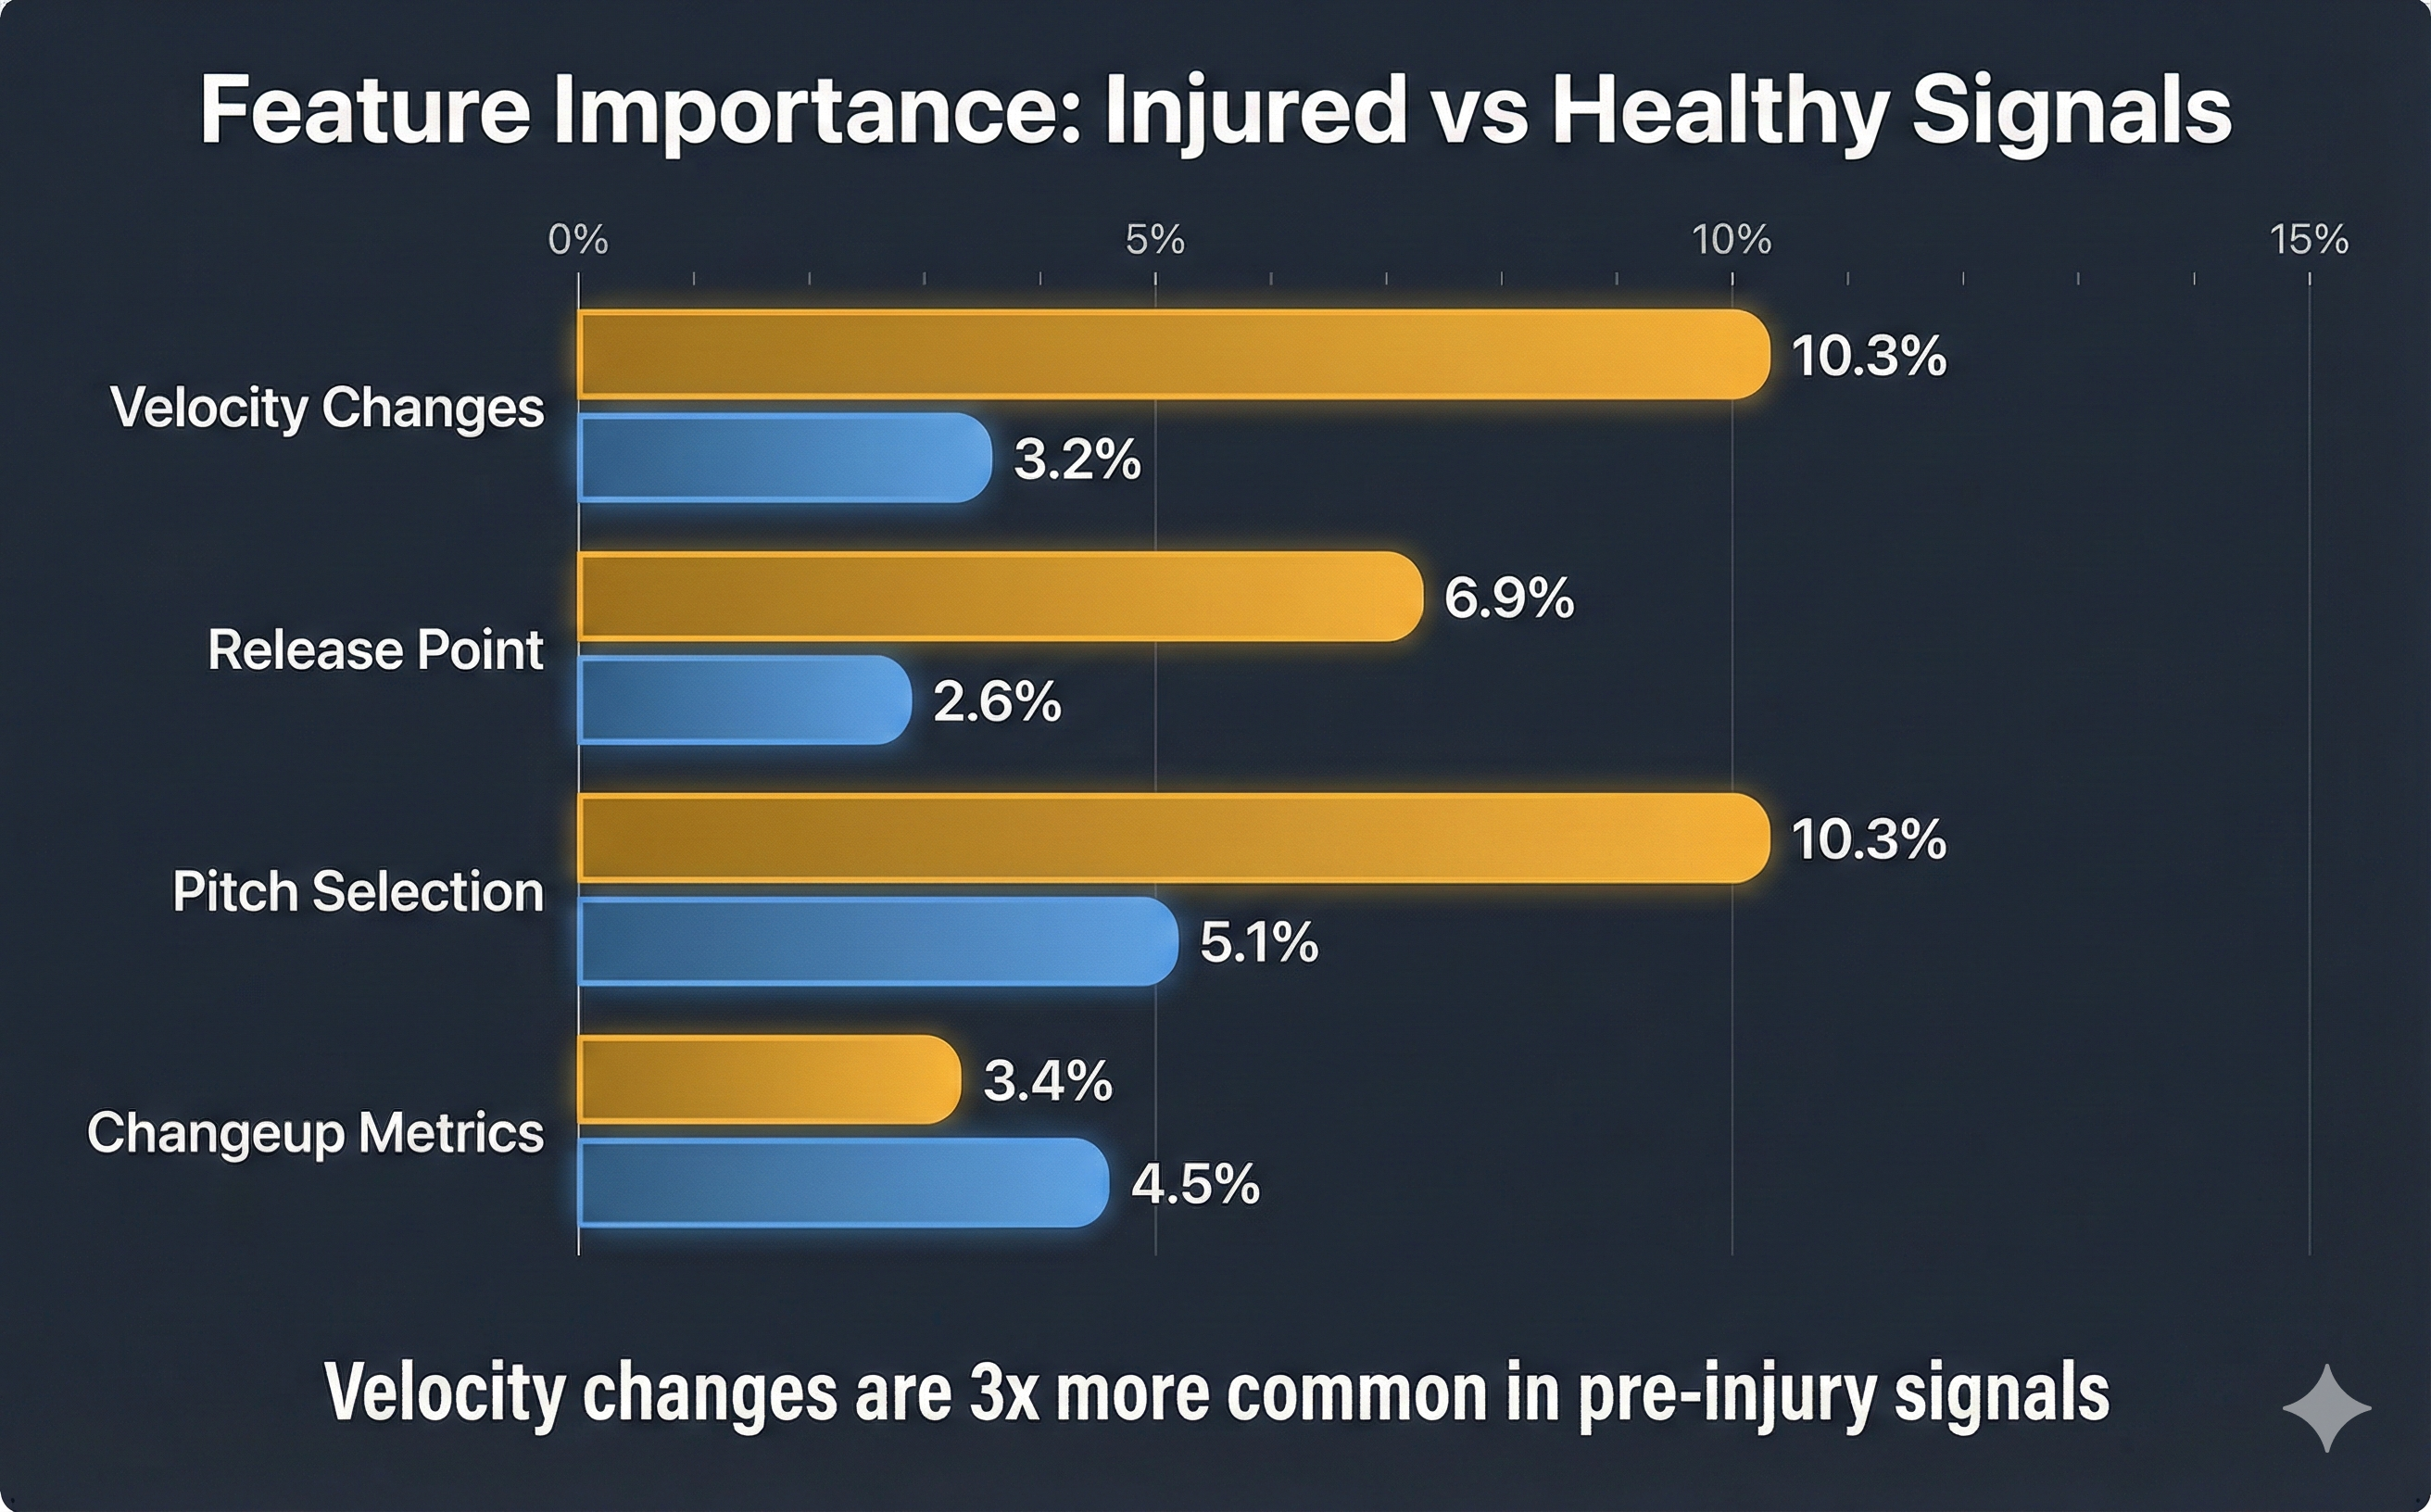
Injured vs Healthy Signals
Why Velocity Matters
When something is wrong with a pitcher's arm, velocity is often the first thing affected - even before the pitcher consciously compensates.
Beyond the Radar Gun
"I don't need AI to tell me his velocity dropped." This critique misses the fundamental value. 81% of injury detections involved changes across 2+ feature categories. Zero detections were velocity-only.
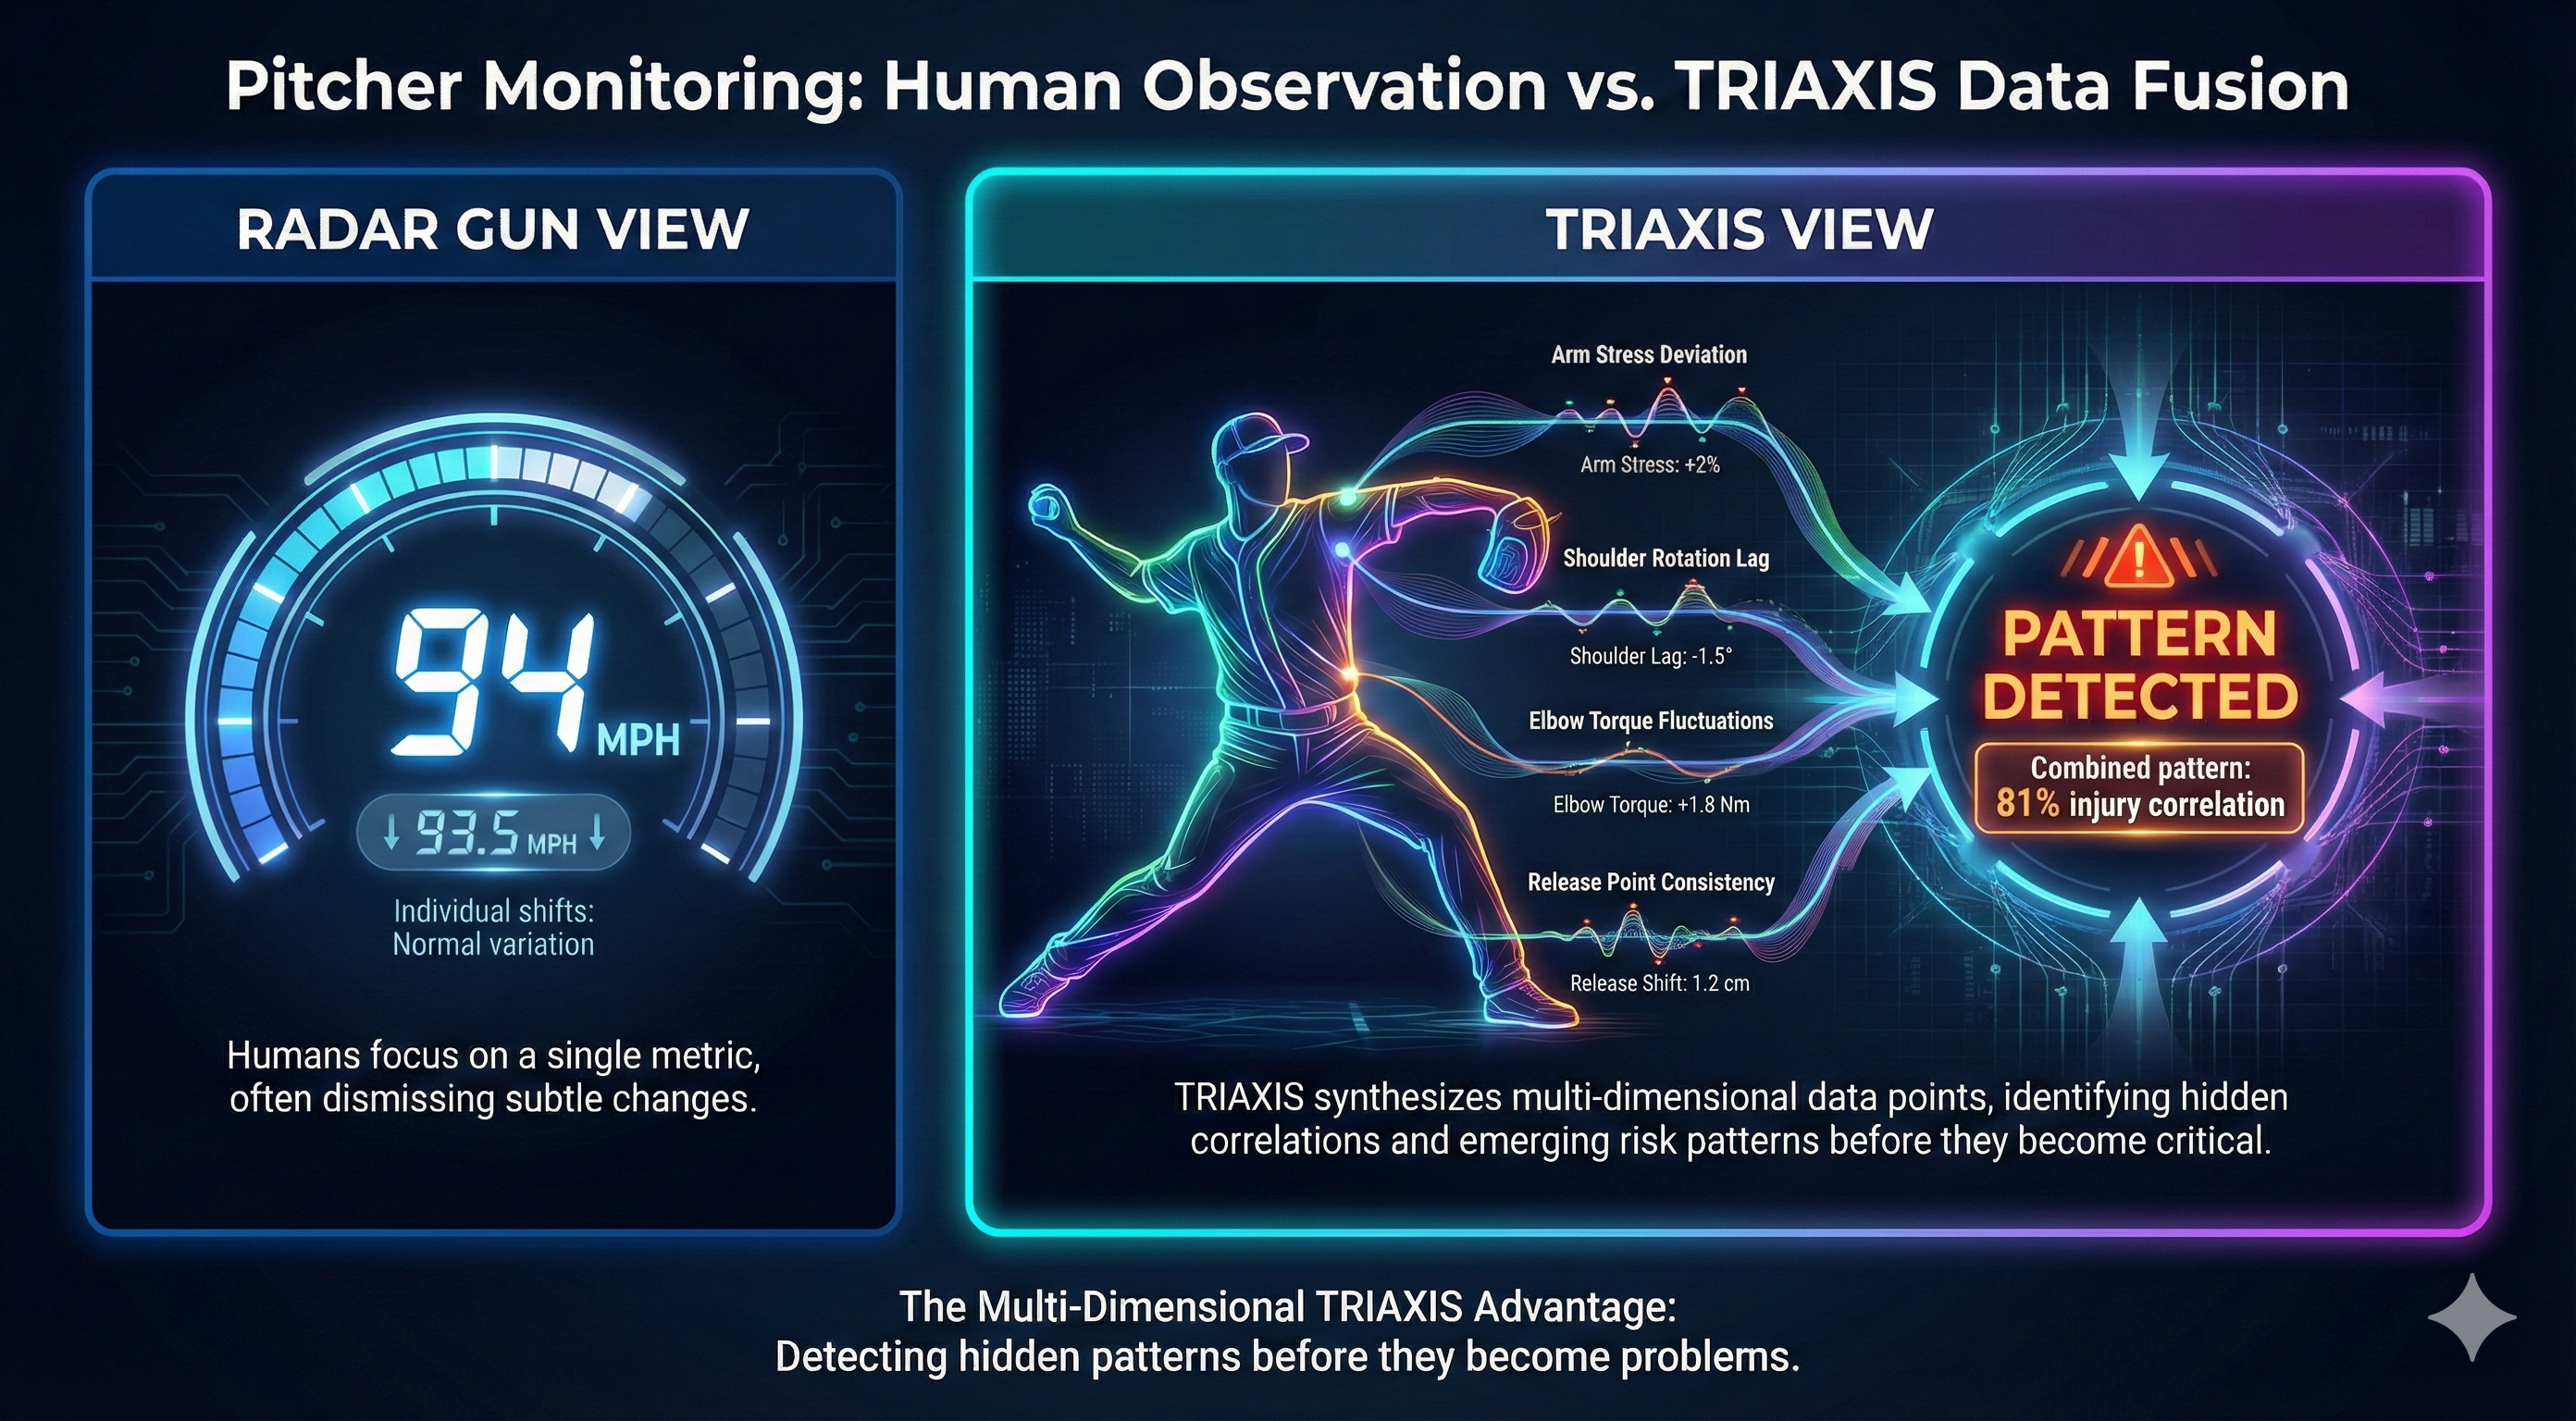
Case Study: Jacob deGrom
Pre-injury signals detected 34 days before his UCL tear:
No coach watching the game would notice these combined shifts. Individually, each is within normal variation. Together, they form a pattern Triaxis AI recognizes as anomalous.
Understanding the Cases We Missed
Of the 3 pitchers we did not detect (among those with data), each case provides important context.
Max Scherzer
Anomaly score: 2.32
Detection threshold: 2.5
Literally on the edge of detection
Lowering threshold slightly would have caught him (with trade-offs).
Shane McClanahan
Anomaly score: -0.22
Actually more consistent than normal
Required Tommy John surgery
Sudden structural failure rather than gradual degradation. Some UCL tears occur catastrophically.
Jesus Luzardo
Anomaly score: 1.49
Injury: Lumbar stress reaction
Spinal bone injury, not soft tissue
Bone injuries in the spine may not manifest through throwing mechanics changes.
The False Positive Question
"Will this just cry wolf constantly?" - A critical question for any detection system.
The Reality
Both healthy and pre-injury pitchers generate alerts at similar rates - approximately 2-3 alert events per 45-day monitoring period. A healthy ace like Framber Valdez triggered 46 alert days across his career data.
The Discriminator: Clustering Patterns
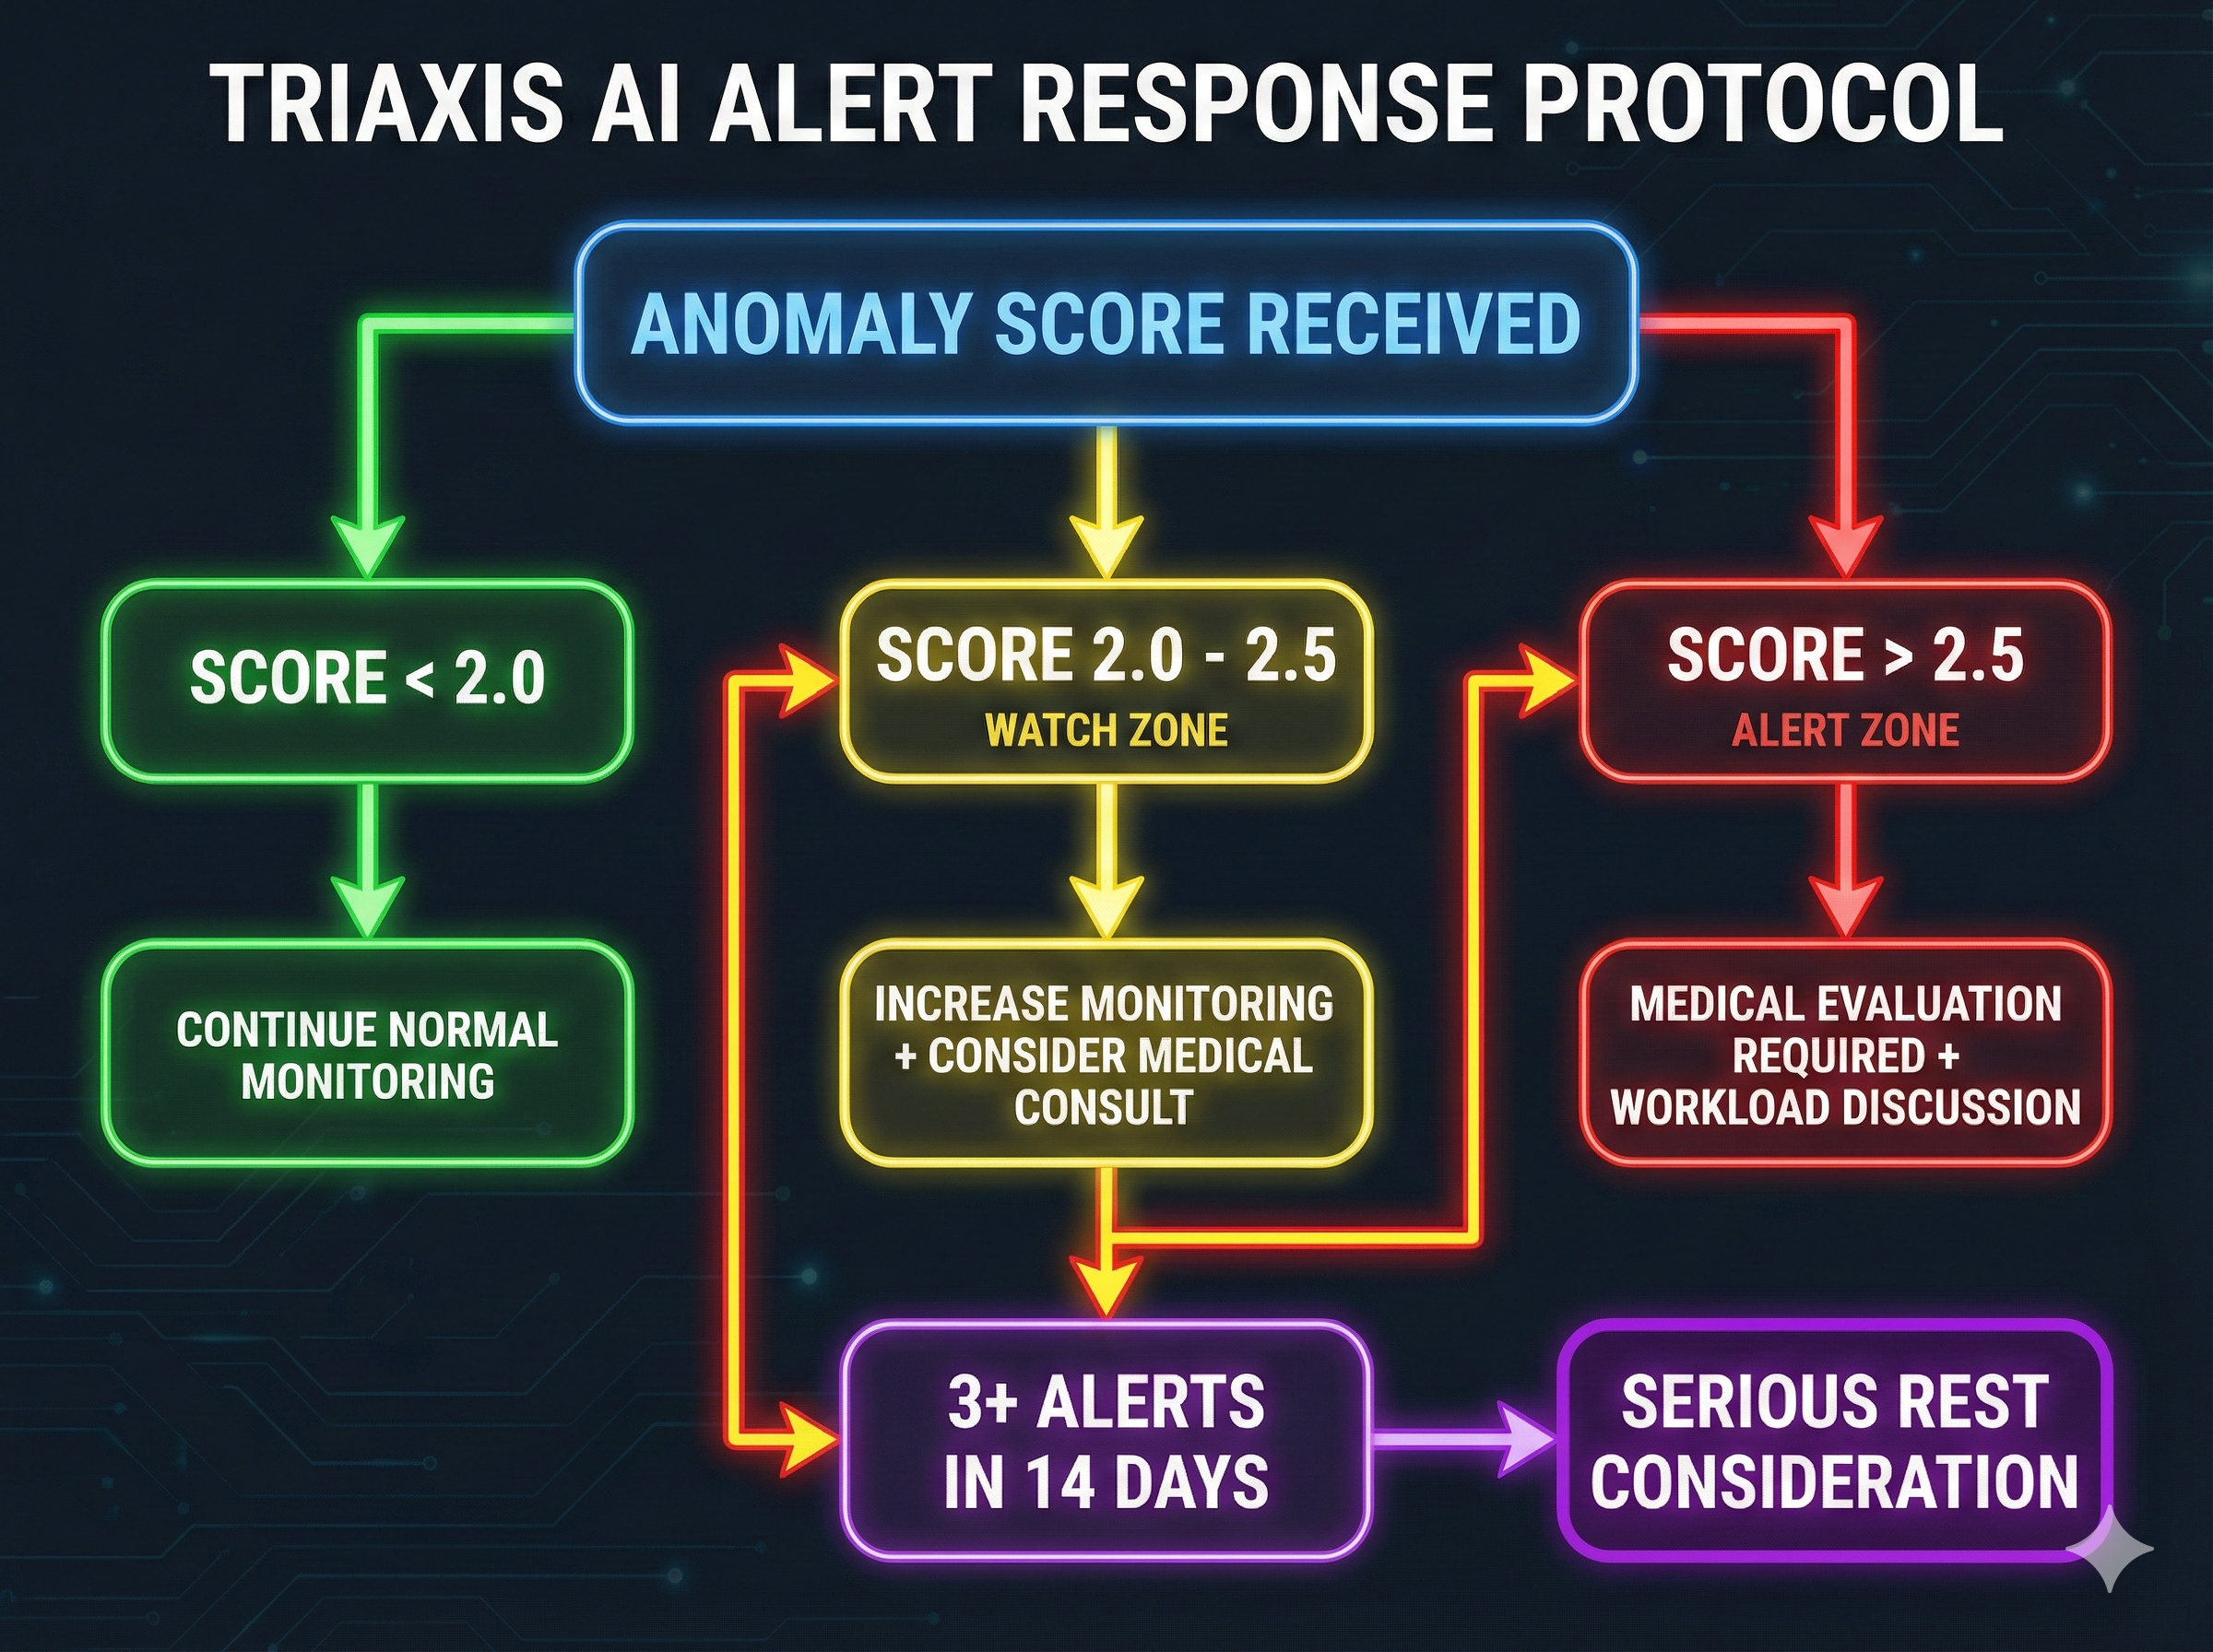
Recommended Alert Response
| Alert Type | Frequency | Response |
|---|---|---|
| Single isolated alert | Common | Note and monitor |
| 2 alerts within 2 weeks | Elevated | Medical consultation |
| 3+ alerts within 2 weeks | High concern | Workload modification, imaging |
Tiered Response Protocol
Single alerts are information; clustered alerts demand action.
What We Can and Cannot Detect
Works Best For
- Gradual-onset arm and shoulder injuries
- Injuries preceded by mechanical compensation
- Pitchers with consistent recent workload
Cannot Detect
- Data gaps (no recent pitching to analyze)
- Sudden catastrophic failures
- Non-mechanical injuries (spinal bone stress)
The Question for MLB Teams
With an 84% detection rate and an average 24-day warning window, Triaxis AI provides teams with something they've never had before: actionable advance notice.
Would you rather know 24 days early, or find out when your ace grabs his elbow and walks off the mound?
What This Research Actually Demonstrates
At its core, this paper validates the detection of subtle drift from personal baseline in high-frequency kinematic data from repetitive motion. The key insight: degradation announces itself through multi-dimensional compensation patterns before failure occurs.
The Pattern We Detected
- - Personal baseline deviation over time
- - Multi-dimensional compensation shifts
- - Clustering of anomalies before failure
- - Subtle changes invisible to observation
Systems With Similar Structure
- - Industrial robot arm calibration drift
- - Surgical instrument precision monitoring
- - Autonomous vehicle control system health
- - CNC machine tool wear detection
- - Physical therapy recovery tracking
The common thread: Any system that performs repetitive motions and degrades gradually can benefit from baseline-relative anomaly detection. The body compensates before it fails. So do machines.
Want the Full Research?
Request the complete whitepaper with all 48 pitcher analyses, detailed methodology, and implementation recommendations.