Signal Clustering Predicts Market Volatility
A Cross-Domain Discovery: The Same Pattern That Predicts Pitcher Injuries Predicts Bitcoin Events
Individual anomaly signals are noise. But when signals cluster together - 2 or more within 14 days - they predict major market events with 98.9% statistical confidence. This is the same pattern we discovered in MLB pitcher injuries, suggesting a universal principle in complex systems approaching critical transitions.
Clustered Signals Predict Major Events
When TRIAXIS detects multiple behavioral anomalies within a short window, it signals that the system is under sustained stress - and a transition is coming.
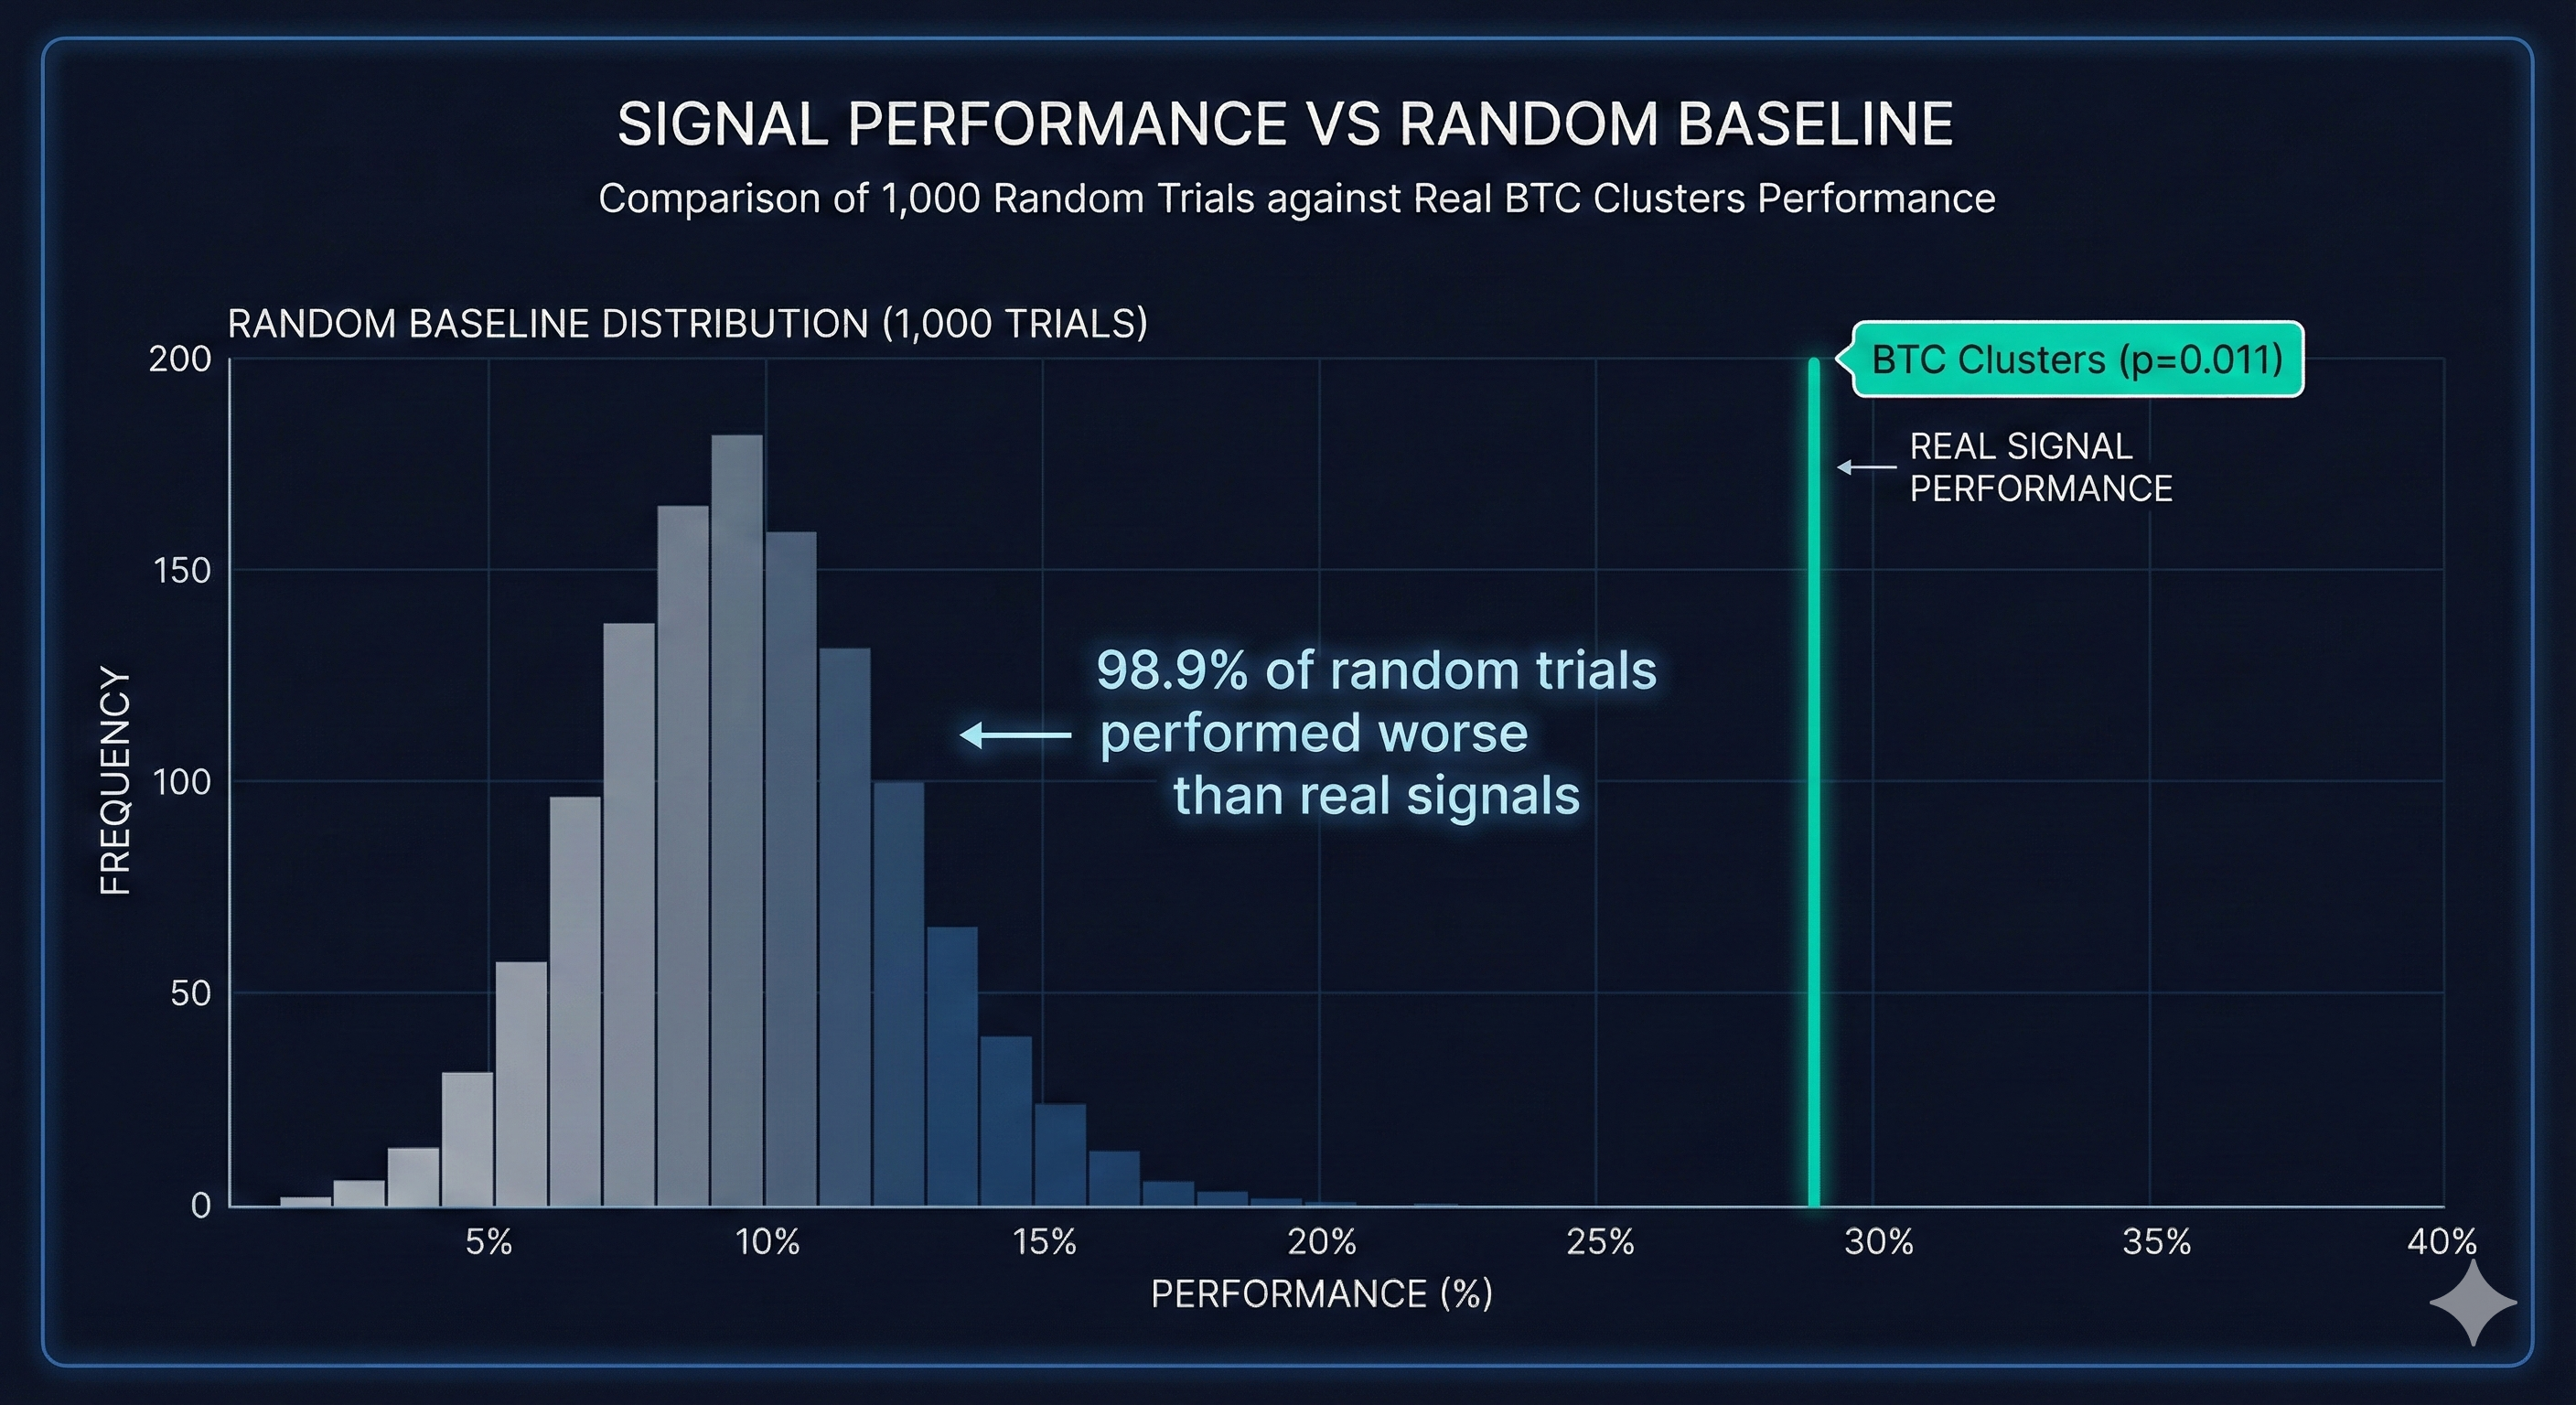
Bitcoin Signal Clustering: Validated at 98.9% Confidence
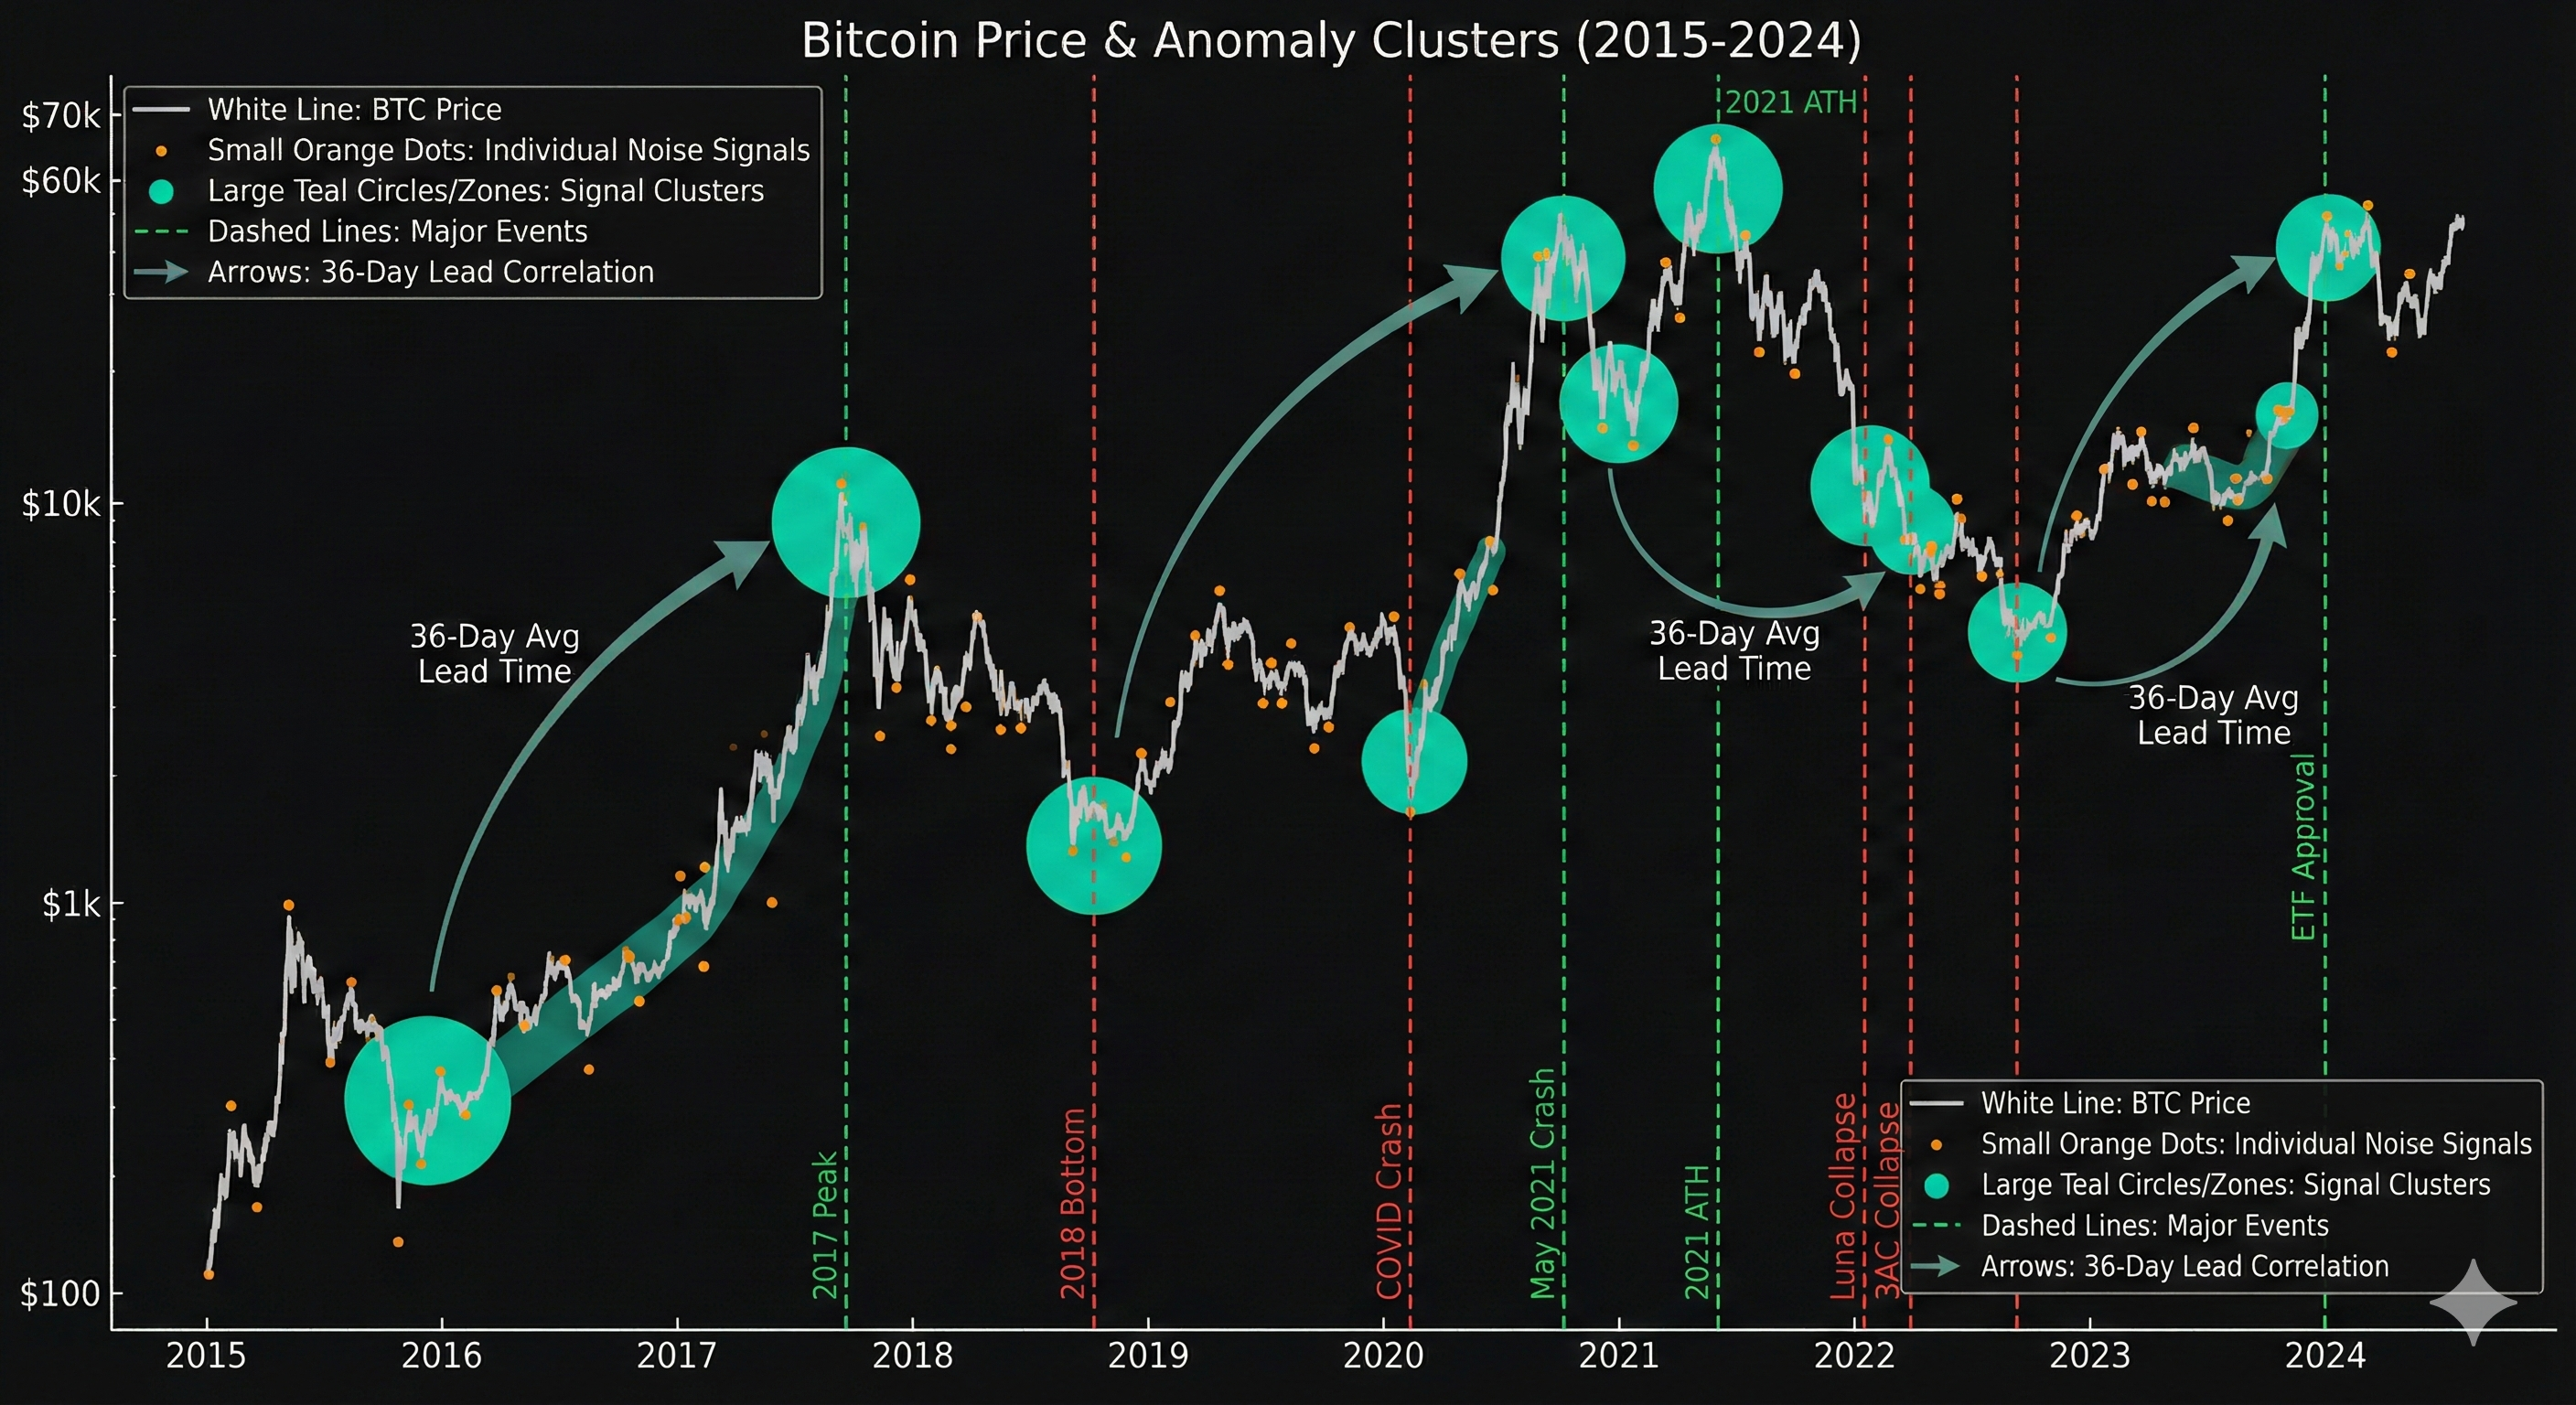
Bitcoin 2015-2024: Signal clusters preceded 9 major events including the 2017 peak, COVID crash, and FTX collapse
The Same Pattern Appears in Pitcher Injuries
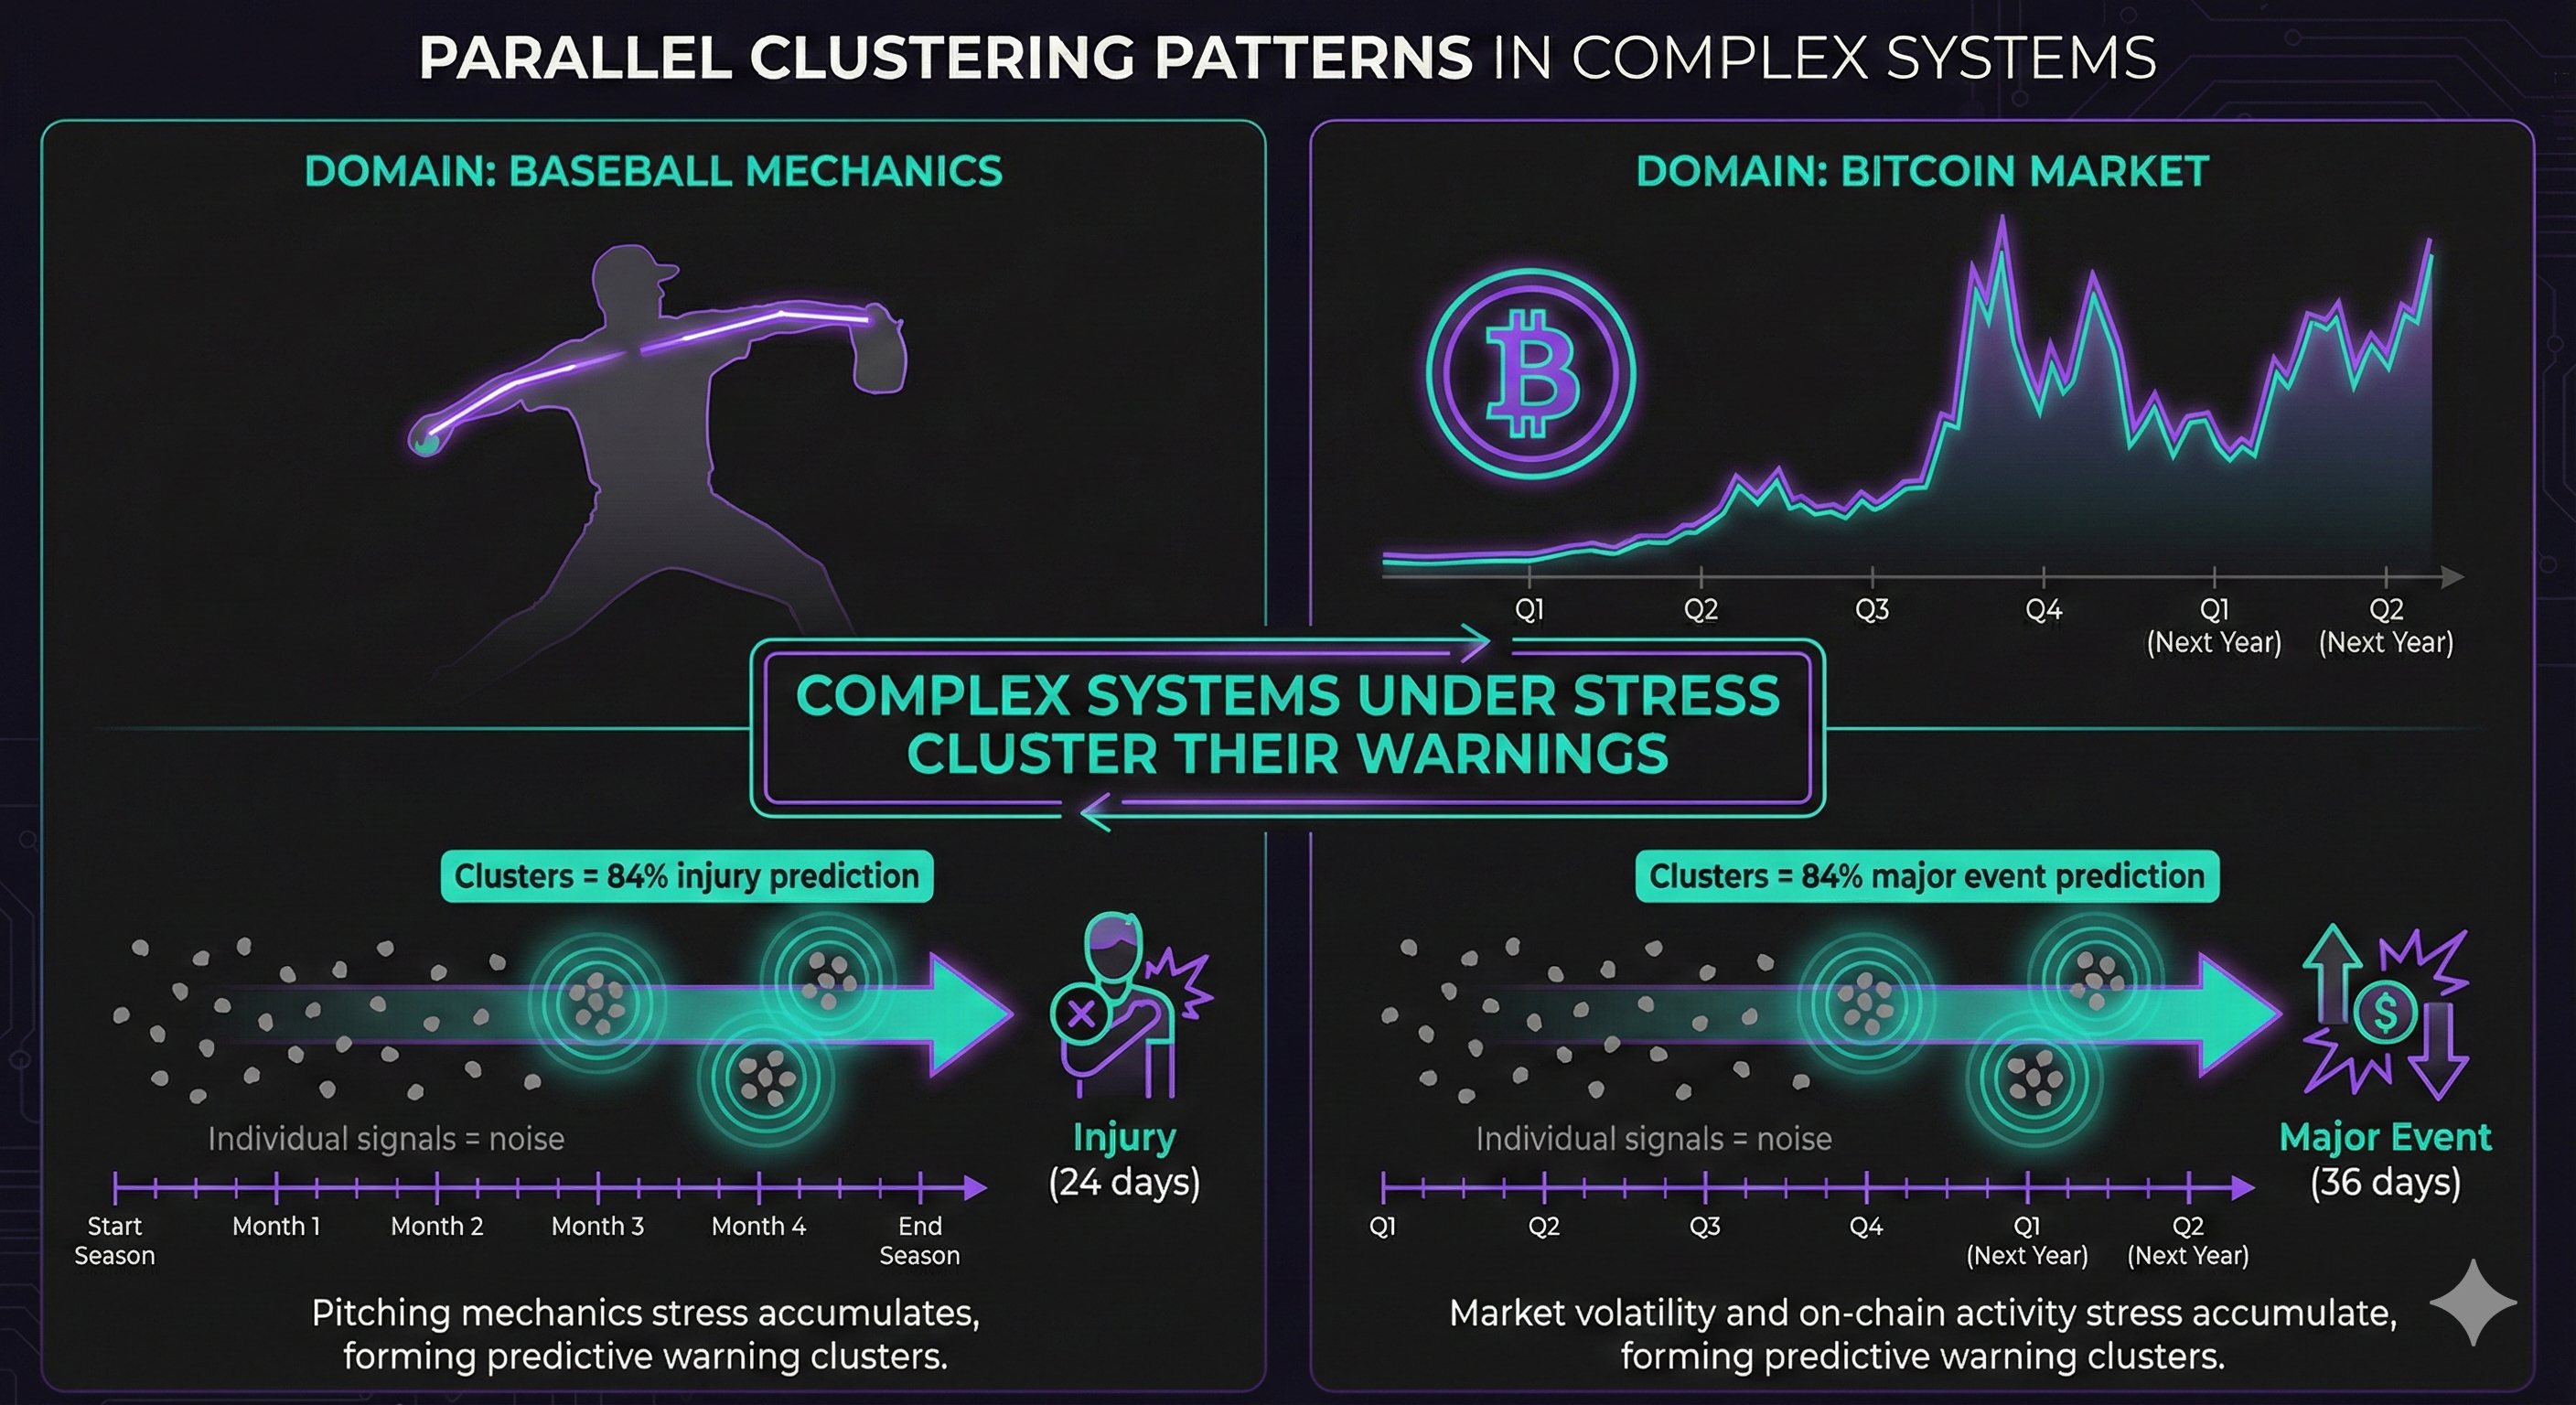
In a separate study, we found that MLB pitcher injuries follow the same pattern: individual anomaly days are noise, but clustered anomalies predict injury with 84% accuracy. This suggests TRIAXIS detects a universal principle.
| Domain | Individual Signals | Clustered Signals | Lead Time |
|---|---|---|---|
MLB Pitchers Arm injury prediction | Noise | 84% injury prediction | 24 days |
Bitcoin Major event prediction | Noise | 28% event rate (p=0.011) | 36 days |
Complex systems under stress cluster their warnings before failure - whether biological or financial
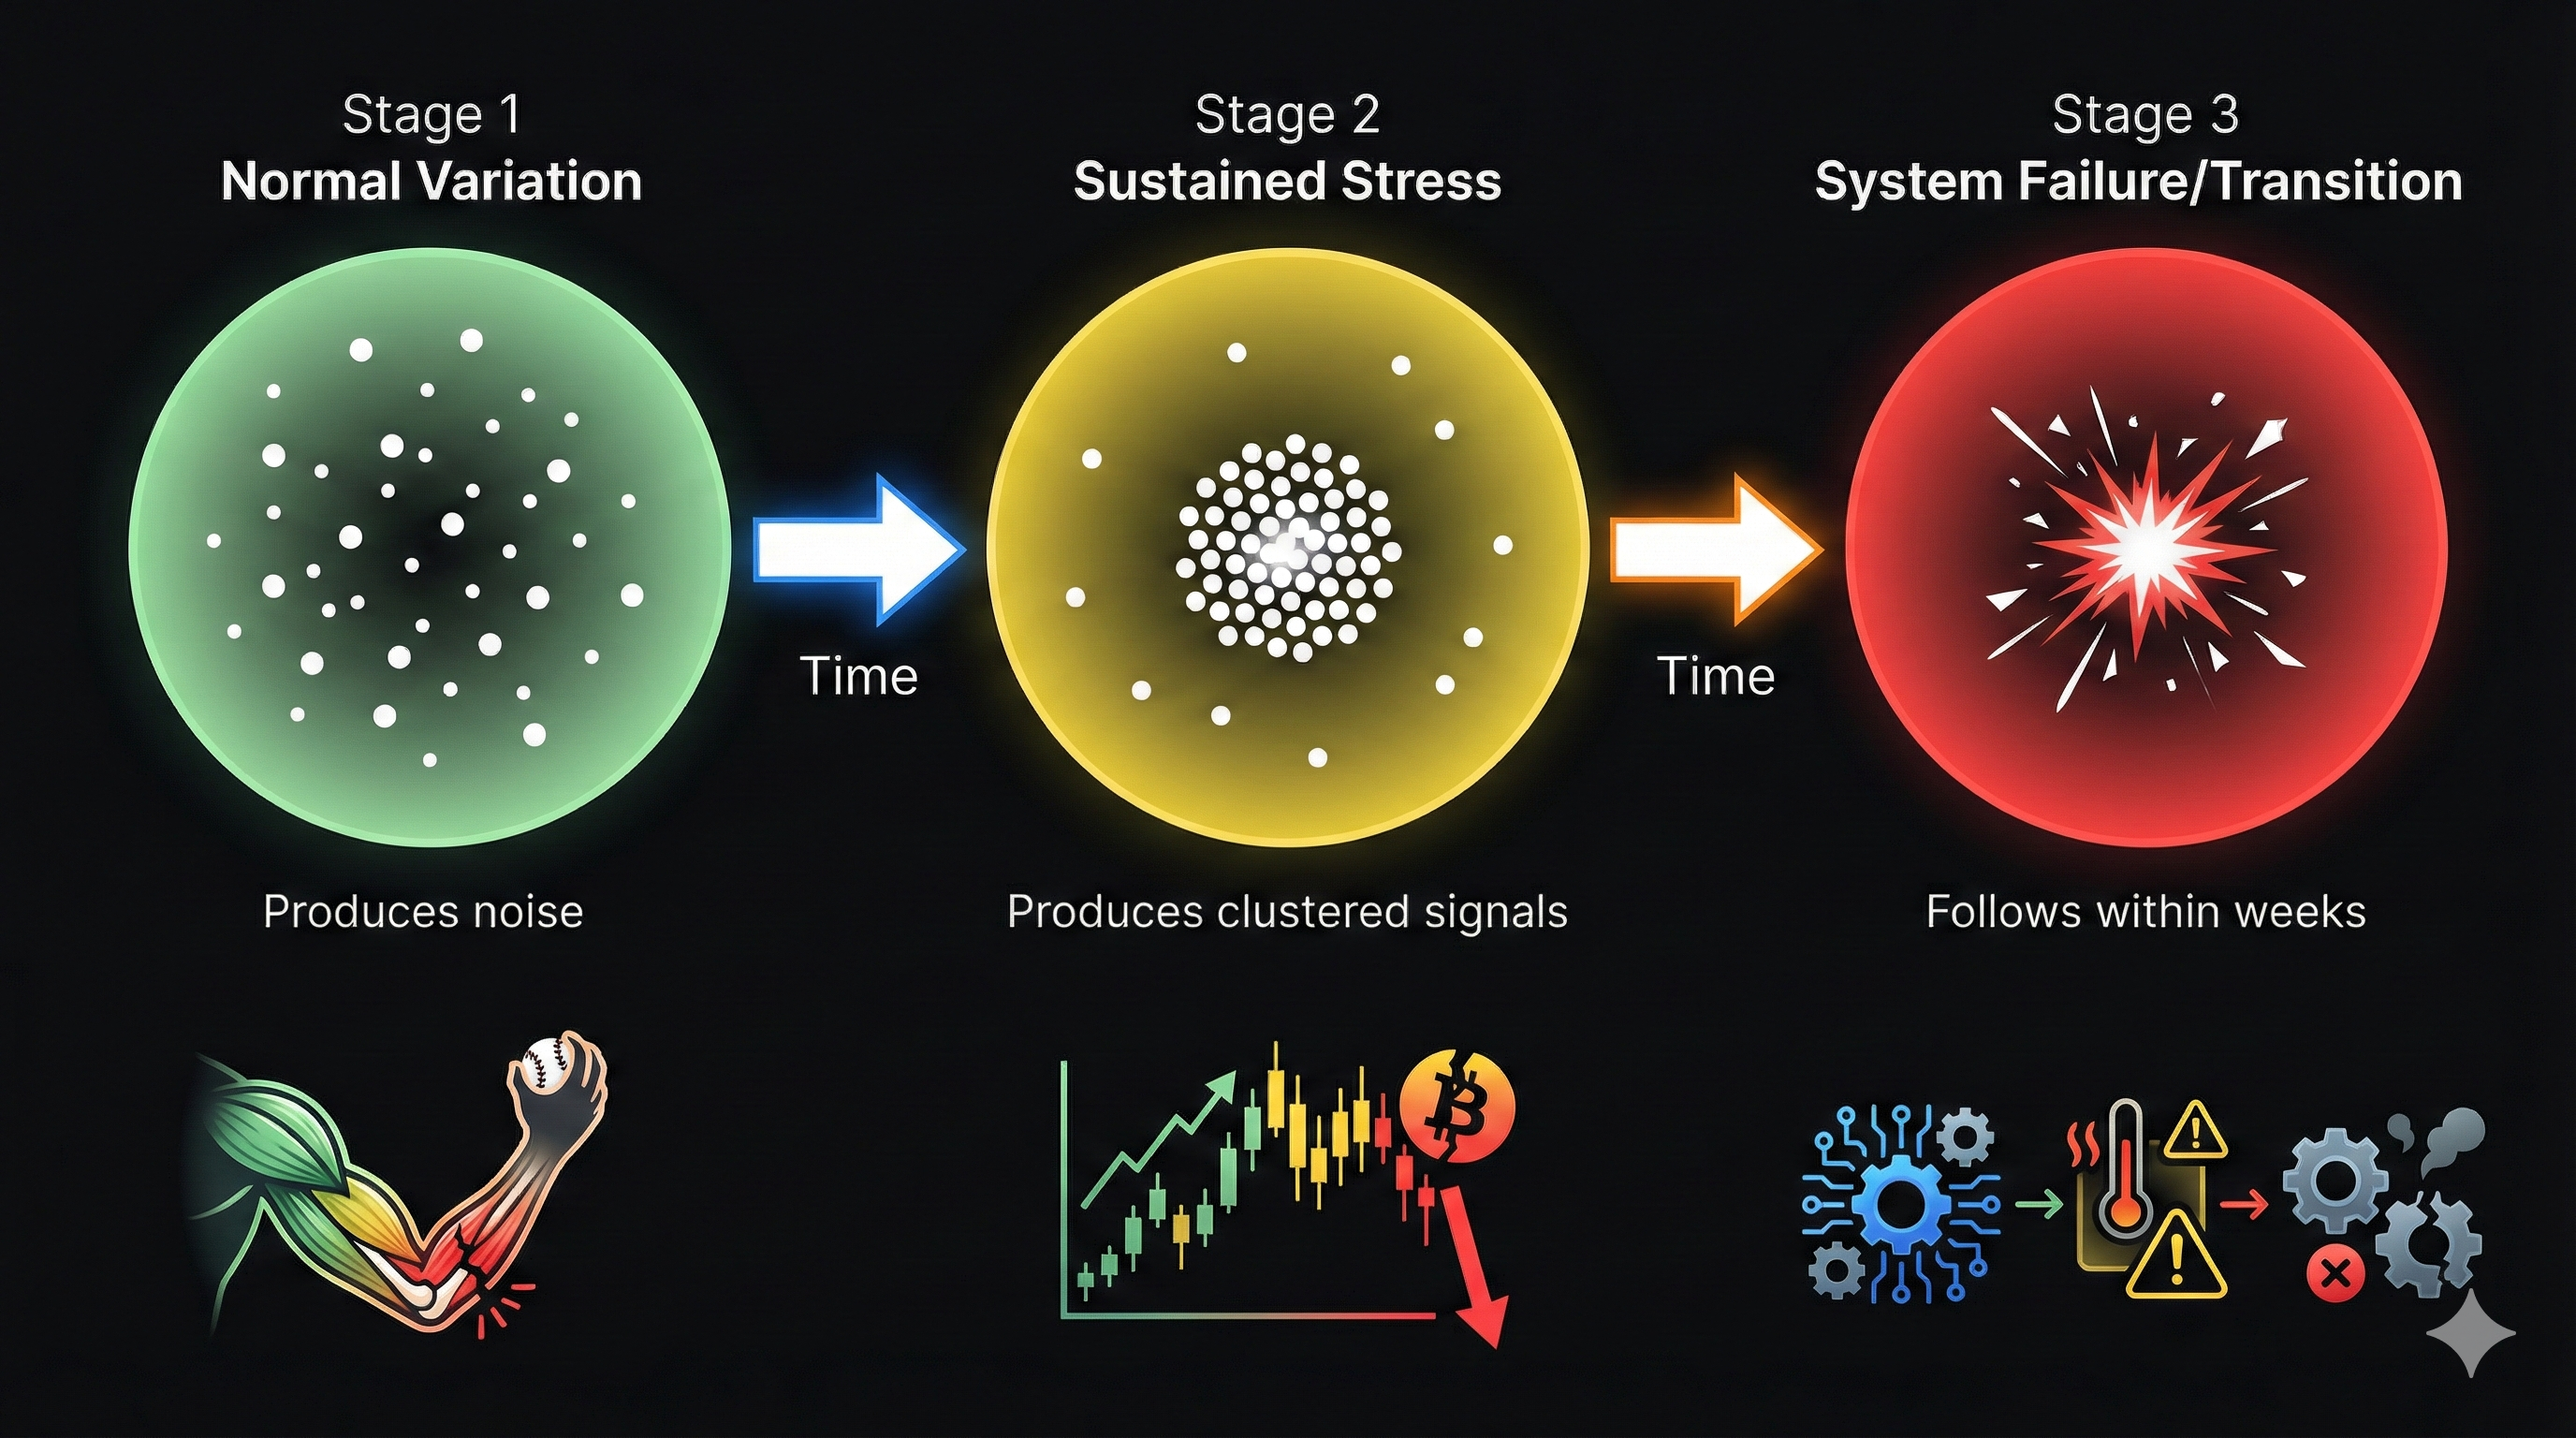
Why Clustering Works
Normal Variation
Every complex system has occasional anomalies - this is noise, not signal
Sustained Stress
When anomalies cluster together, the system is under real pressure
System Transition
Major change follows within weeks - injury, crash, or rally
Why Bitcoin?
Less efficient than equities, more retail-driven, with dramatic 50%+ events that create clear signal-to-noise
Why Not Equities?
Equity ETFs are too efficient - clustering effects exist but are too weak for statistical significance
Why Pitchers?
Single biological system under repeated stress - similar dynamics to a single asset under market pressure
Individual Signals vs. Clustered Signals
The key insight: it's not about finding anomalies - it's about finding patterns of anomalies.
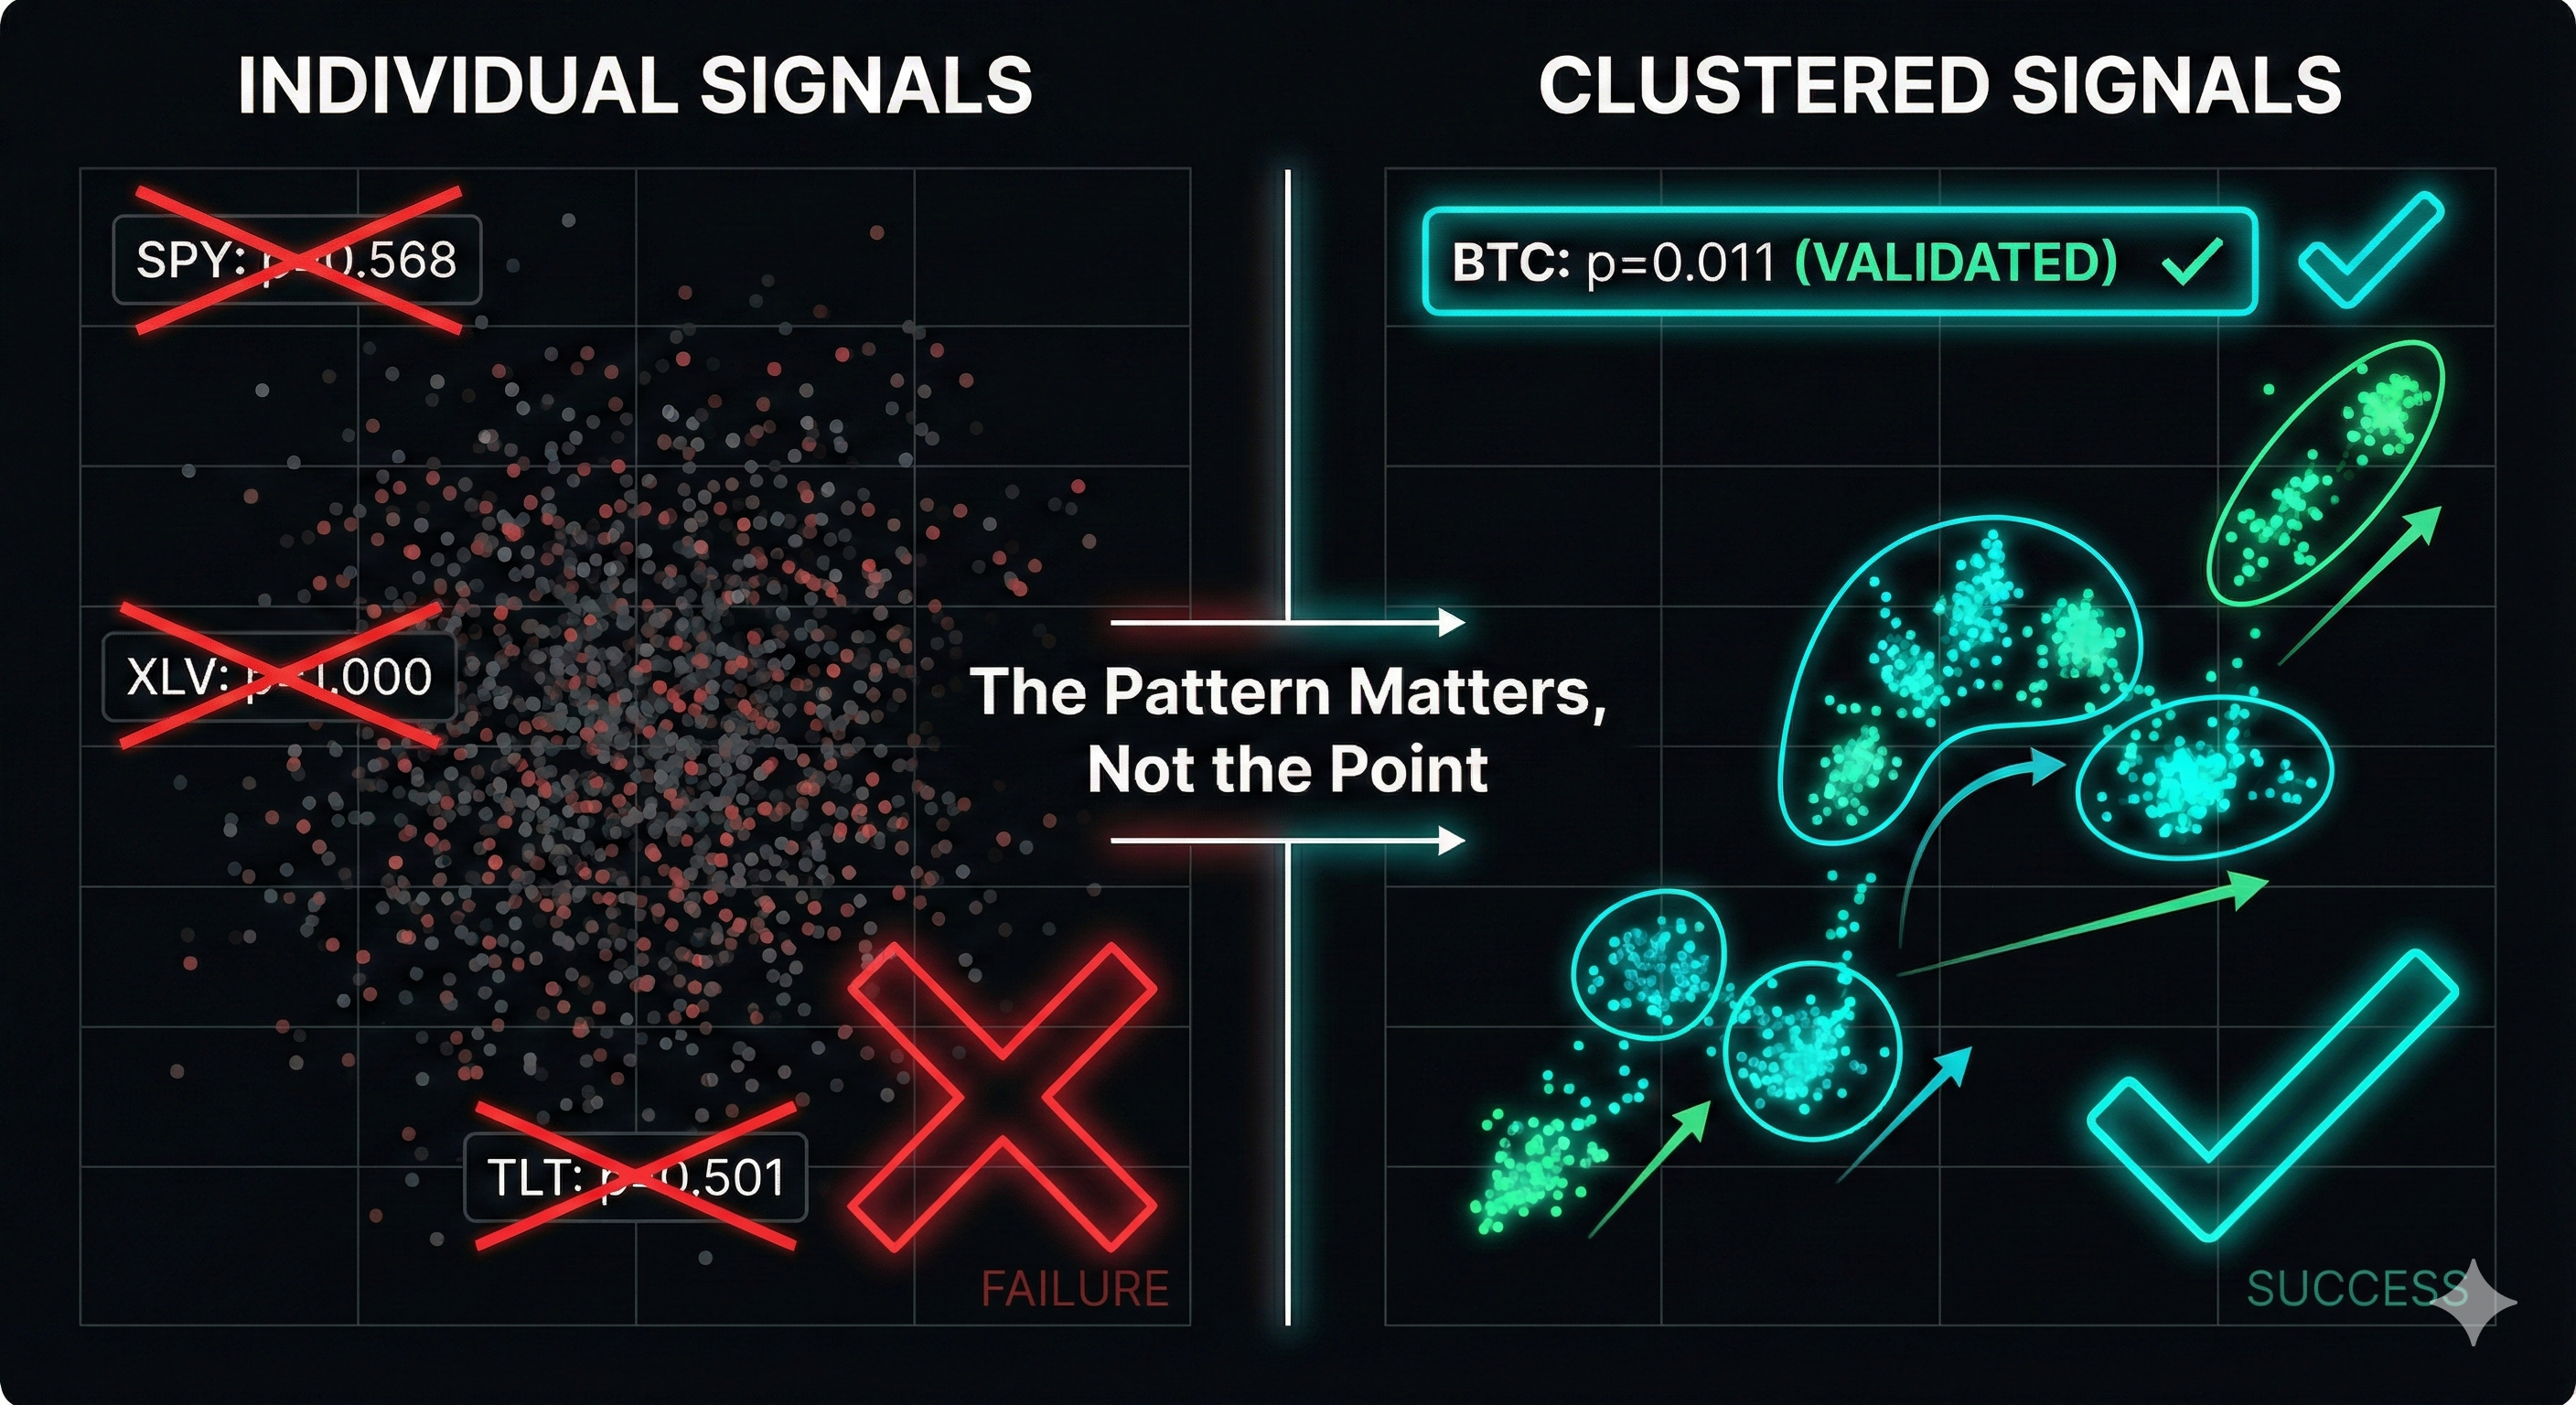
The pattern matters, not the point
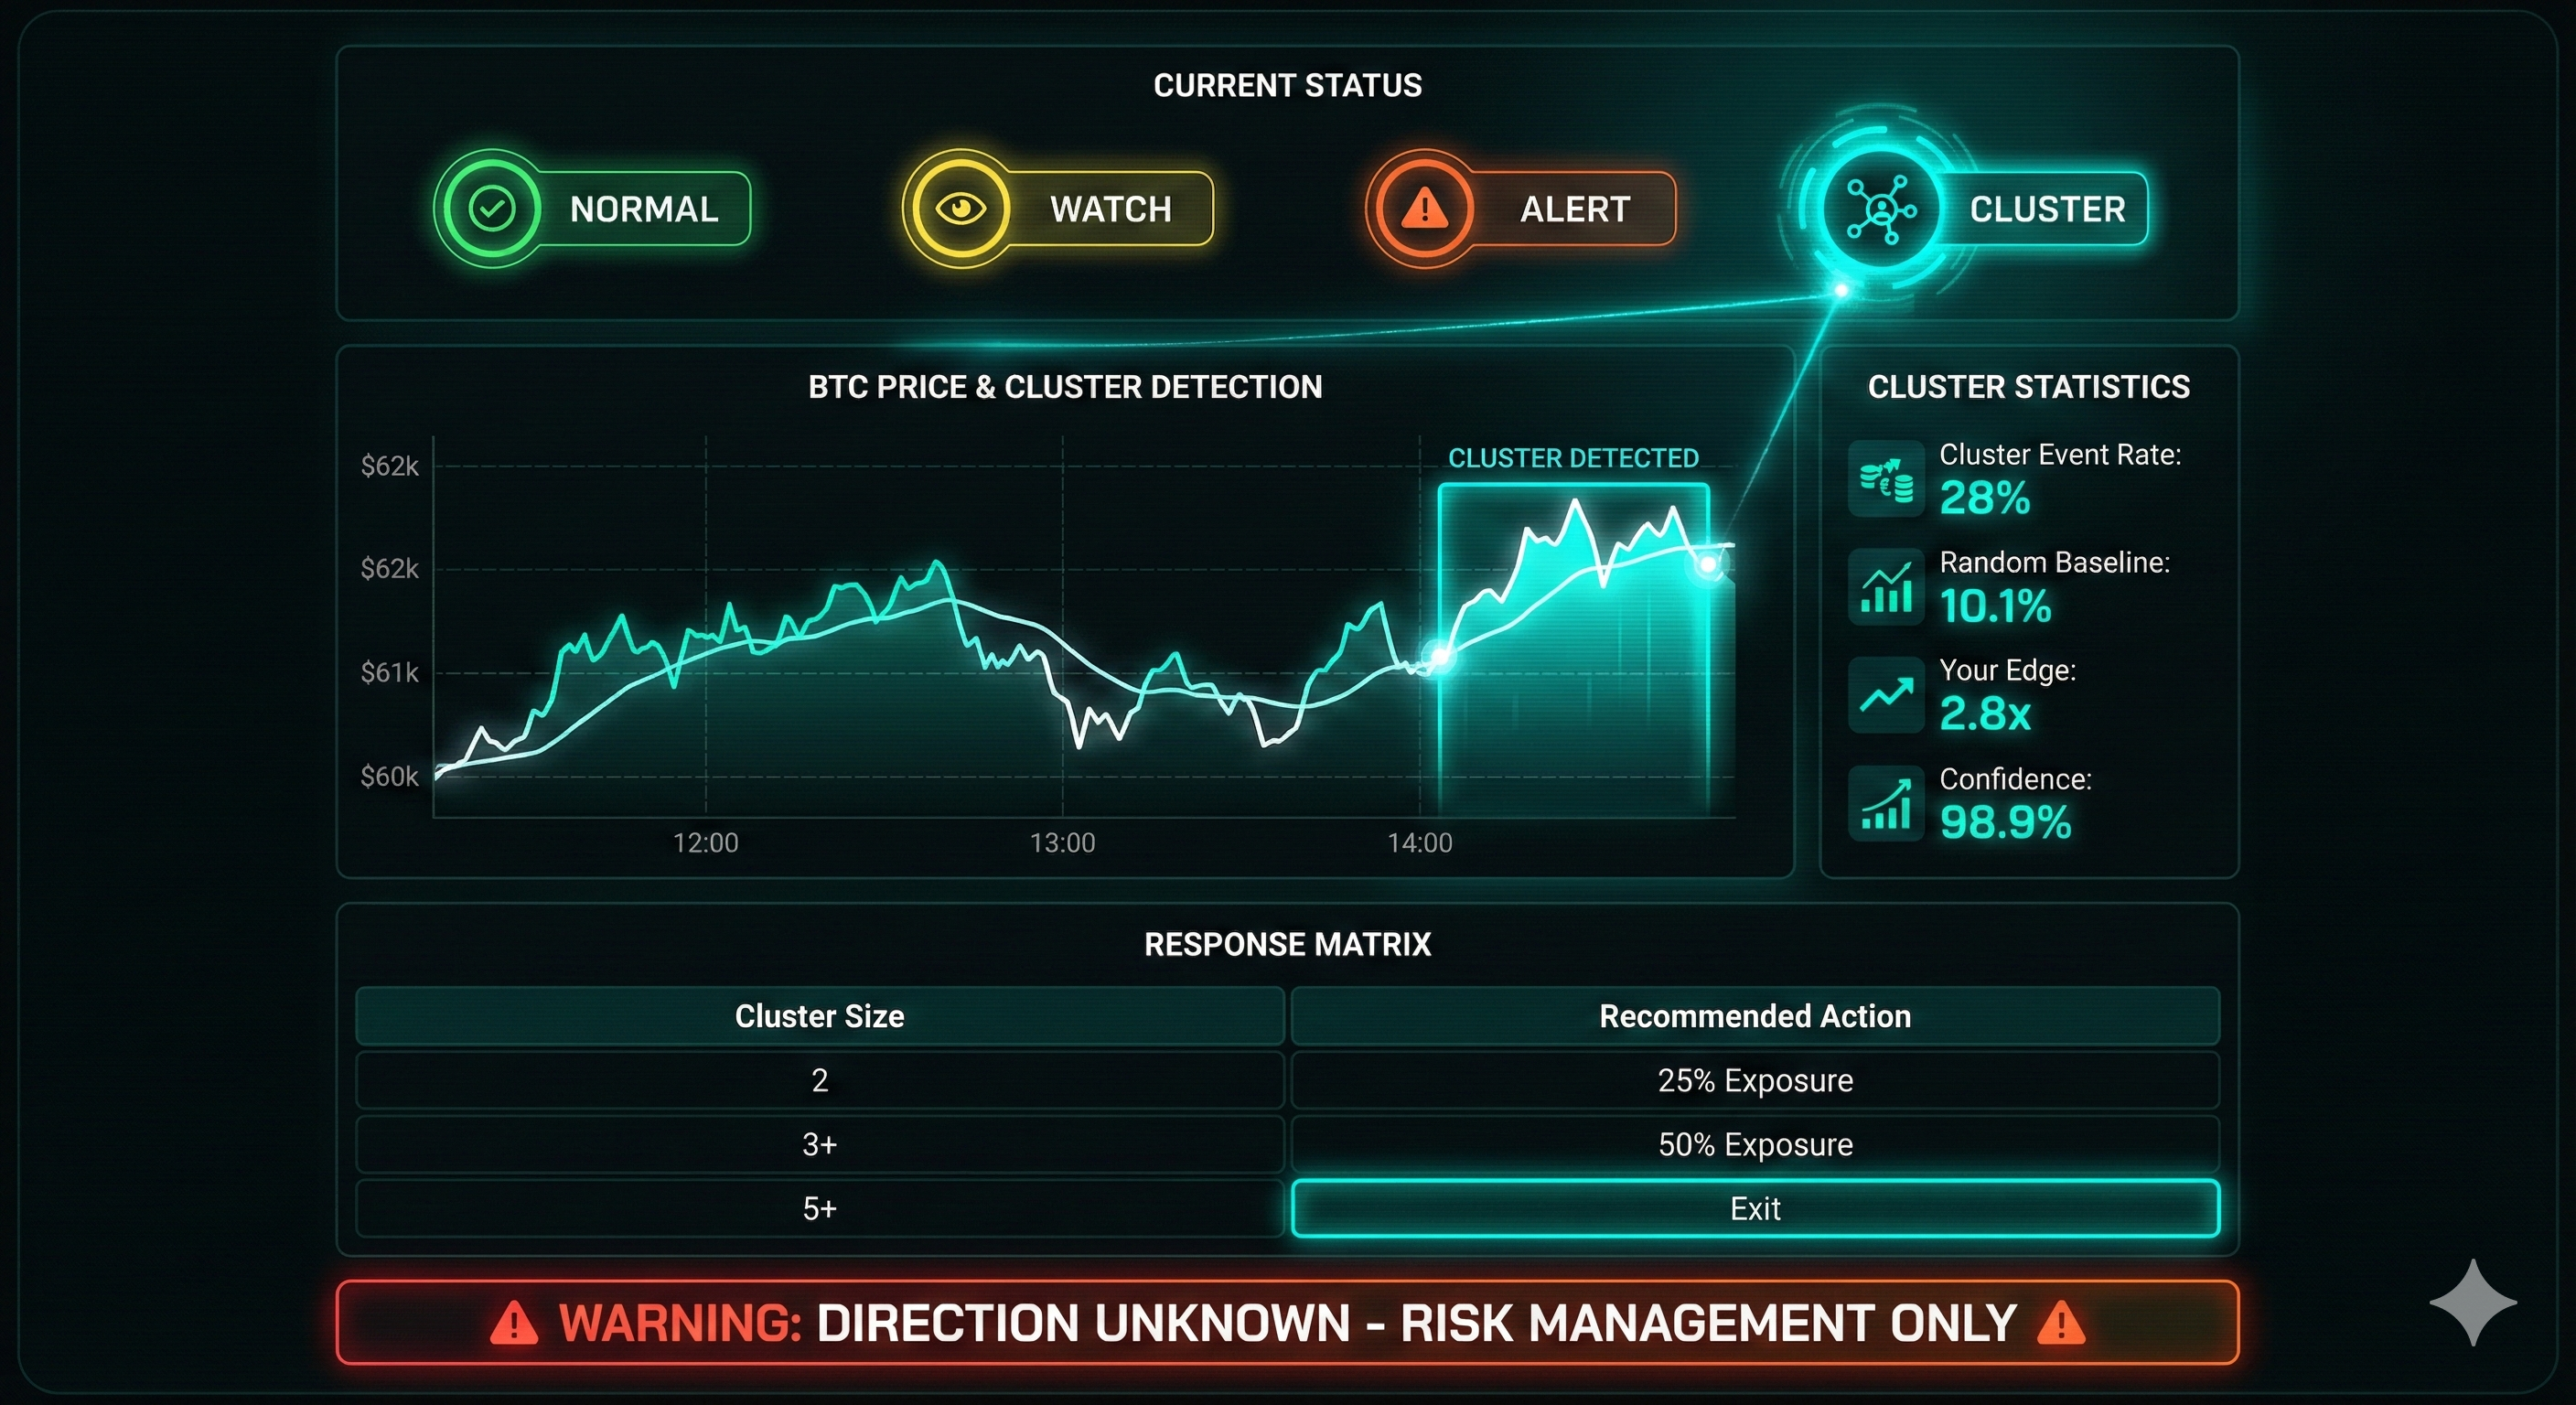
BTC Cluster Monitoring Protocol
How to use signal clustering for Bitcoin risk management
Signal Definitions
When a Cluster is Detected
Recommended Response
| Cluster Size | Action |
|---|---|
| 2 signals in 14 days | Reduce exposure 25%, tighten stops |
| 3+ signals in 14 days | Reduce exposure 50%, prepare for volatility |
| 5+ signals in 14 days | Consider full exit or hedge |
Important: Risk Management, Not Trading Signals
Clusters predict volatility, not direction. 72% of clusters will not precede events (false alarms). Use this for risk management - reducing exposure before potential turbulence - not for placing directional bets.
Methodology
Data
- 18 years of equity ETF data (SPY, XLV, TLT, DIA, XLI)
- 10 years of cryptocurrency data (BTC-USD, ETH-USD)
- 77-dimensional behavioral feature vectors from OHLCV
- 9 catalogued Bitcoin events, 13 market events
Validation
- Monte Carlo simulation with 1,000 random trials
- p-value = (trials >= real performance) / 1,000
- Significance threshold: p < 0.05
- BTC clustering: p=0.011 (VALIDATED)
Signal Detection Process
- 1.Submit 60-day rolling windows to TRIAXIS engine
- 2.Calculate rolling z-scores of anomaly rates (252-day baseline)
- 3.Flag dates where z-score > 2.5 as "signals"
- 4.Identify "clusters" as 2+ signals within 14 days
- 5.Validate against catalogued events via Monte Carlo
Key Takeaways
Signal Clustering is Validated
Bitcoin clusters predict major events 2.8x better than random with 98.9% statistical confidence
Cross-Domain Pattern
The same clustering pattern predicts MLB pitcher injuries (84%) - suggesting a universal principle in complex systems
Risk Management Application
Clusters predict volatility, not direction - use for reducing exposure before turbulence, not for trading signals
Scope Limitation
Validated for Bitcoin only - equity ETF clustering effects are too weak for statistical significance
Research Disclaimer: This paper presents historical analysis. It does not constitute investment advice or trading recommendations. Past performance does not indicate future results. The 72% false alarm rate means most clusters will not precede events.
Want the Full Research?
Request the complete whitepaper with detailed methodology, event catalogs, and statistical validation.