Geographic Contagion in U.S. Housing Markets
Real-Time Detection Using Anomaly Detection on High-Frequency Metro-Level Data
A novel methodology for detecting and tracking the geographic spread of housing market stress across U.S. metropolitan areas, powered by Triaxis AI domain-agnostic anomaly detection.
Housing market stress spreads geographically with identifiable leader-follower relationships
Abstract
This paper presents a novel methodology for detecting and tracking the geographic spread of housing market stress across U.S. metropolitan areas. Using weekly housing data from 932 metropolitan statistical areas (MSAs) spanning 2012-2024, we construct a comprehensive contagion network that identifies leading and following markets with an average transmission lag of 1.7 months.
Our approach combines multi-metric stress indicators with Triaxis AI, a domain-agnostic anomaly detection engine, to identify 12 anomalous contagion periods, with significant clustering around the 2022 housing correction.
Watch the Explainer
A brief walkthrough of this housing contagion research and its findings
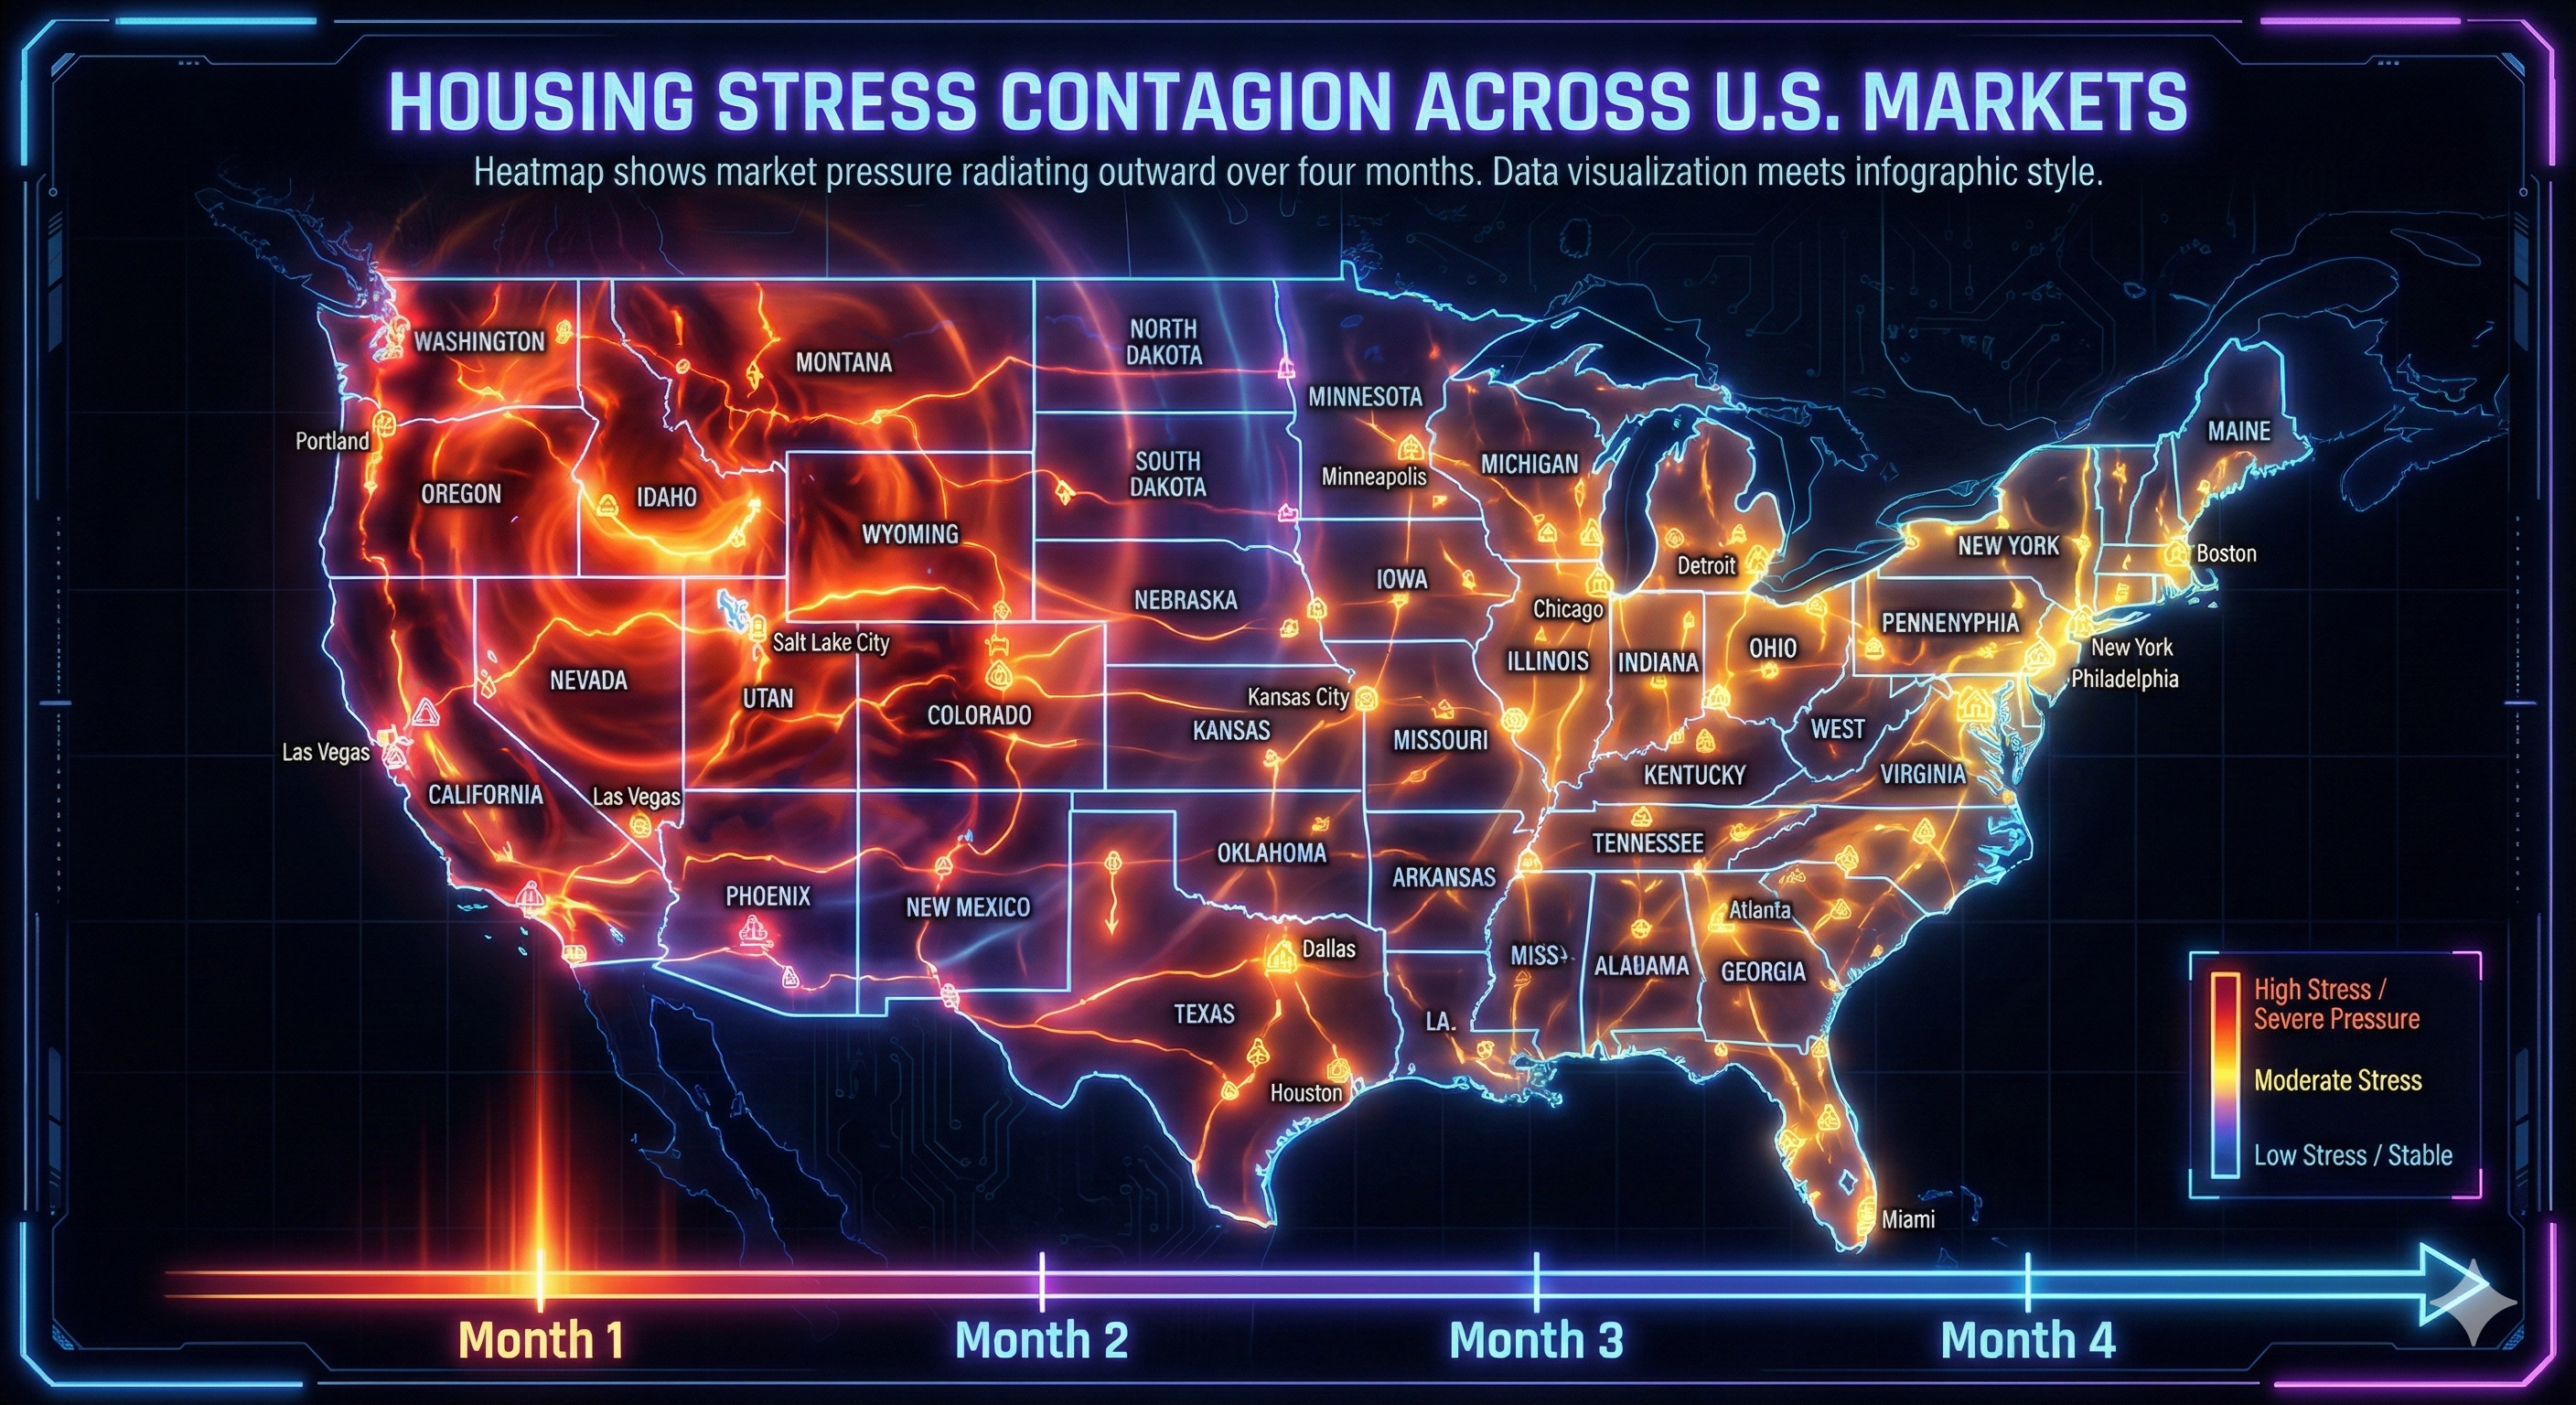
The Problem: Housing Stress Spreads, But How?
Housing market corrections have historically caused significant economic damage. The 2008 financial crisis, triggered by housing market collapse, resulted in $19.2 trillion in household wealth destruction. The 2022 housing correction saw home prices decline in 98% of metropolitan areas.
"When stress emerges in one housing market, how quickly does it spread to others, and which markets are affected first?"
Stress Index Construction
We construct a composite stress index from nine underlying metrics using Z-score normalization over a 12-month rolling window.
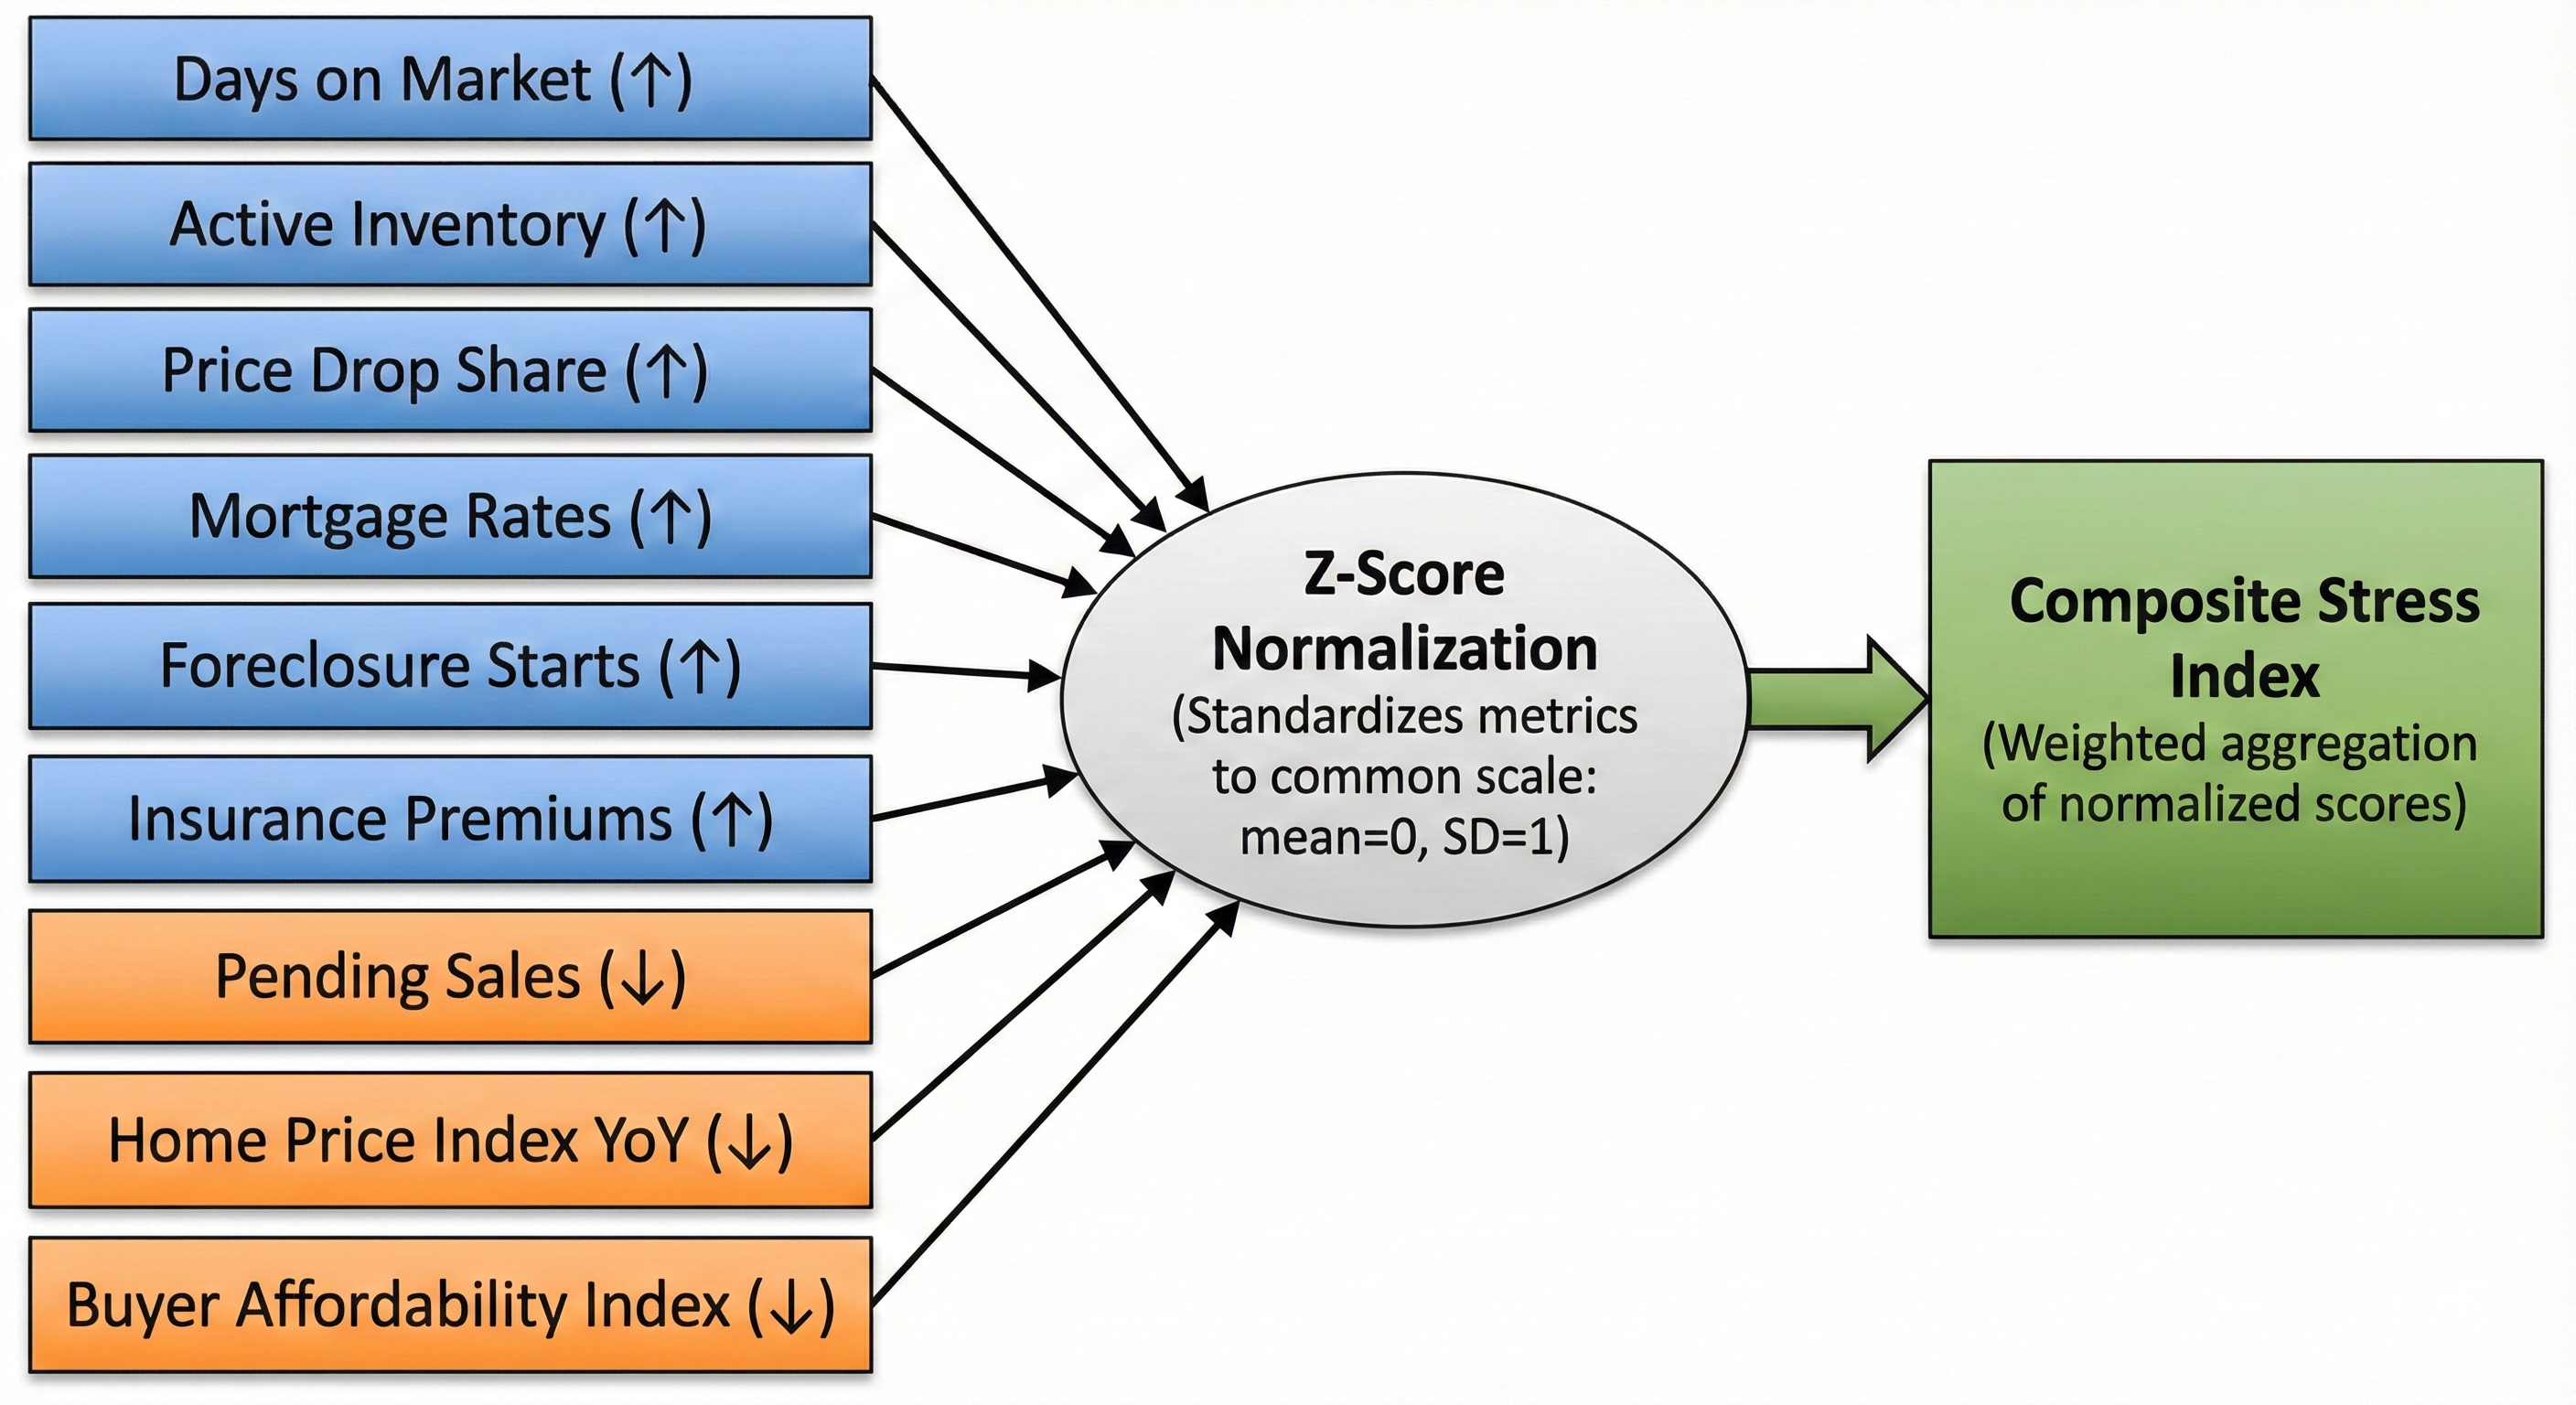
Stress-Increasing Metrics
- - Median days on market
- - Active inventory
- - Months of supply
- - Price drops percentage
Stress-Decreasing Metrics (inverted)
- - Average sale-to-list ratio
- - Homes sold above list
- - Off-market within two weeks
- - Pending sales & homes sold
Contagion Network Analysis
Our analysis identified 91,973 statistically significant leader-follower relationships among the 932 metropolitan areas studied.
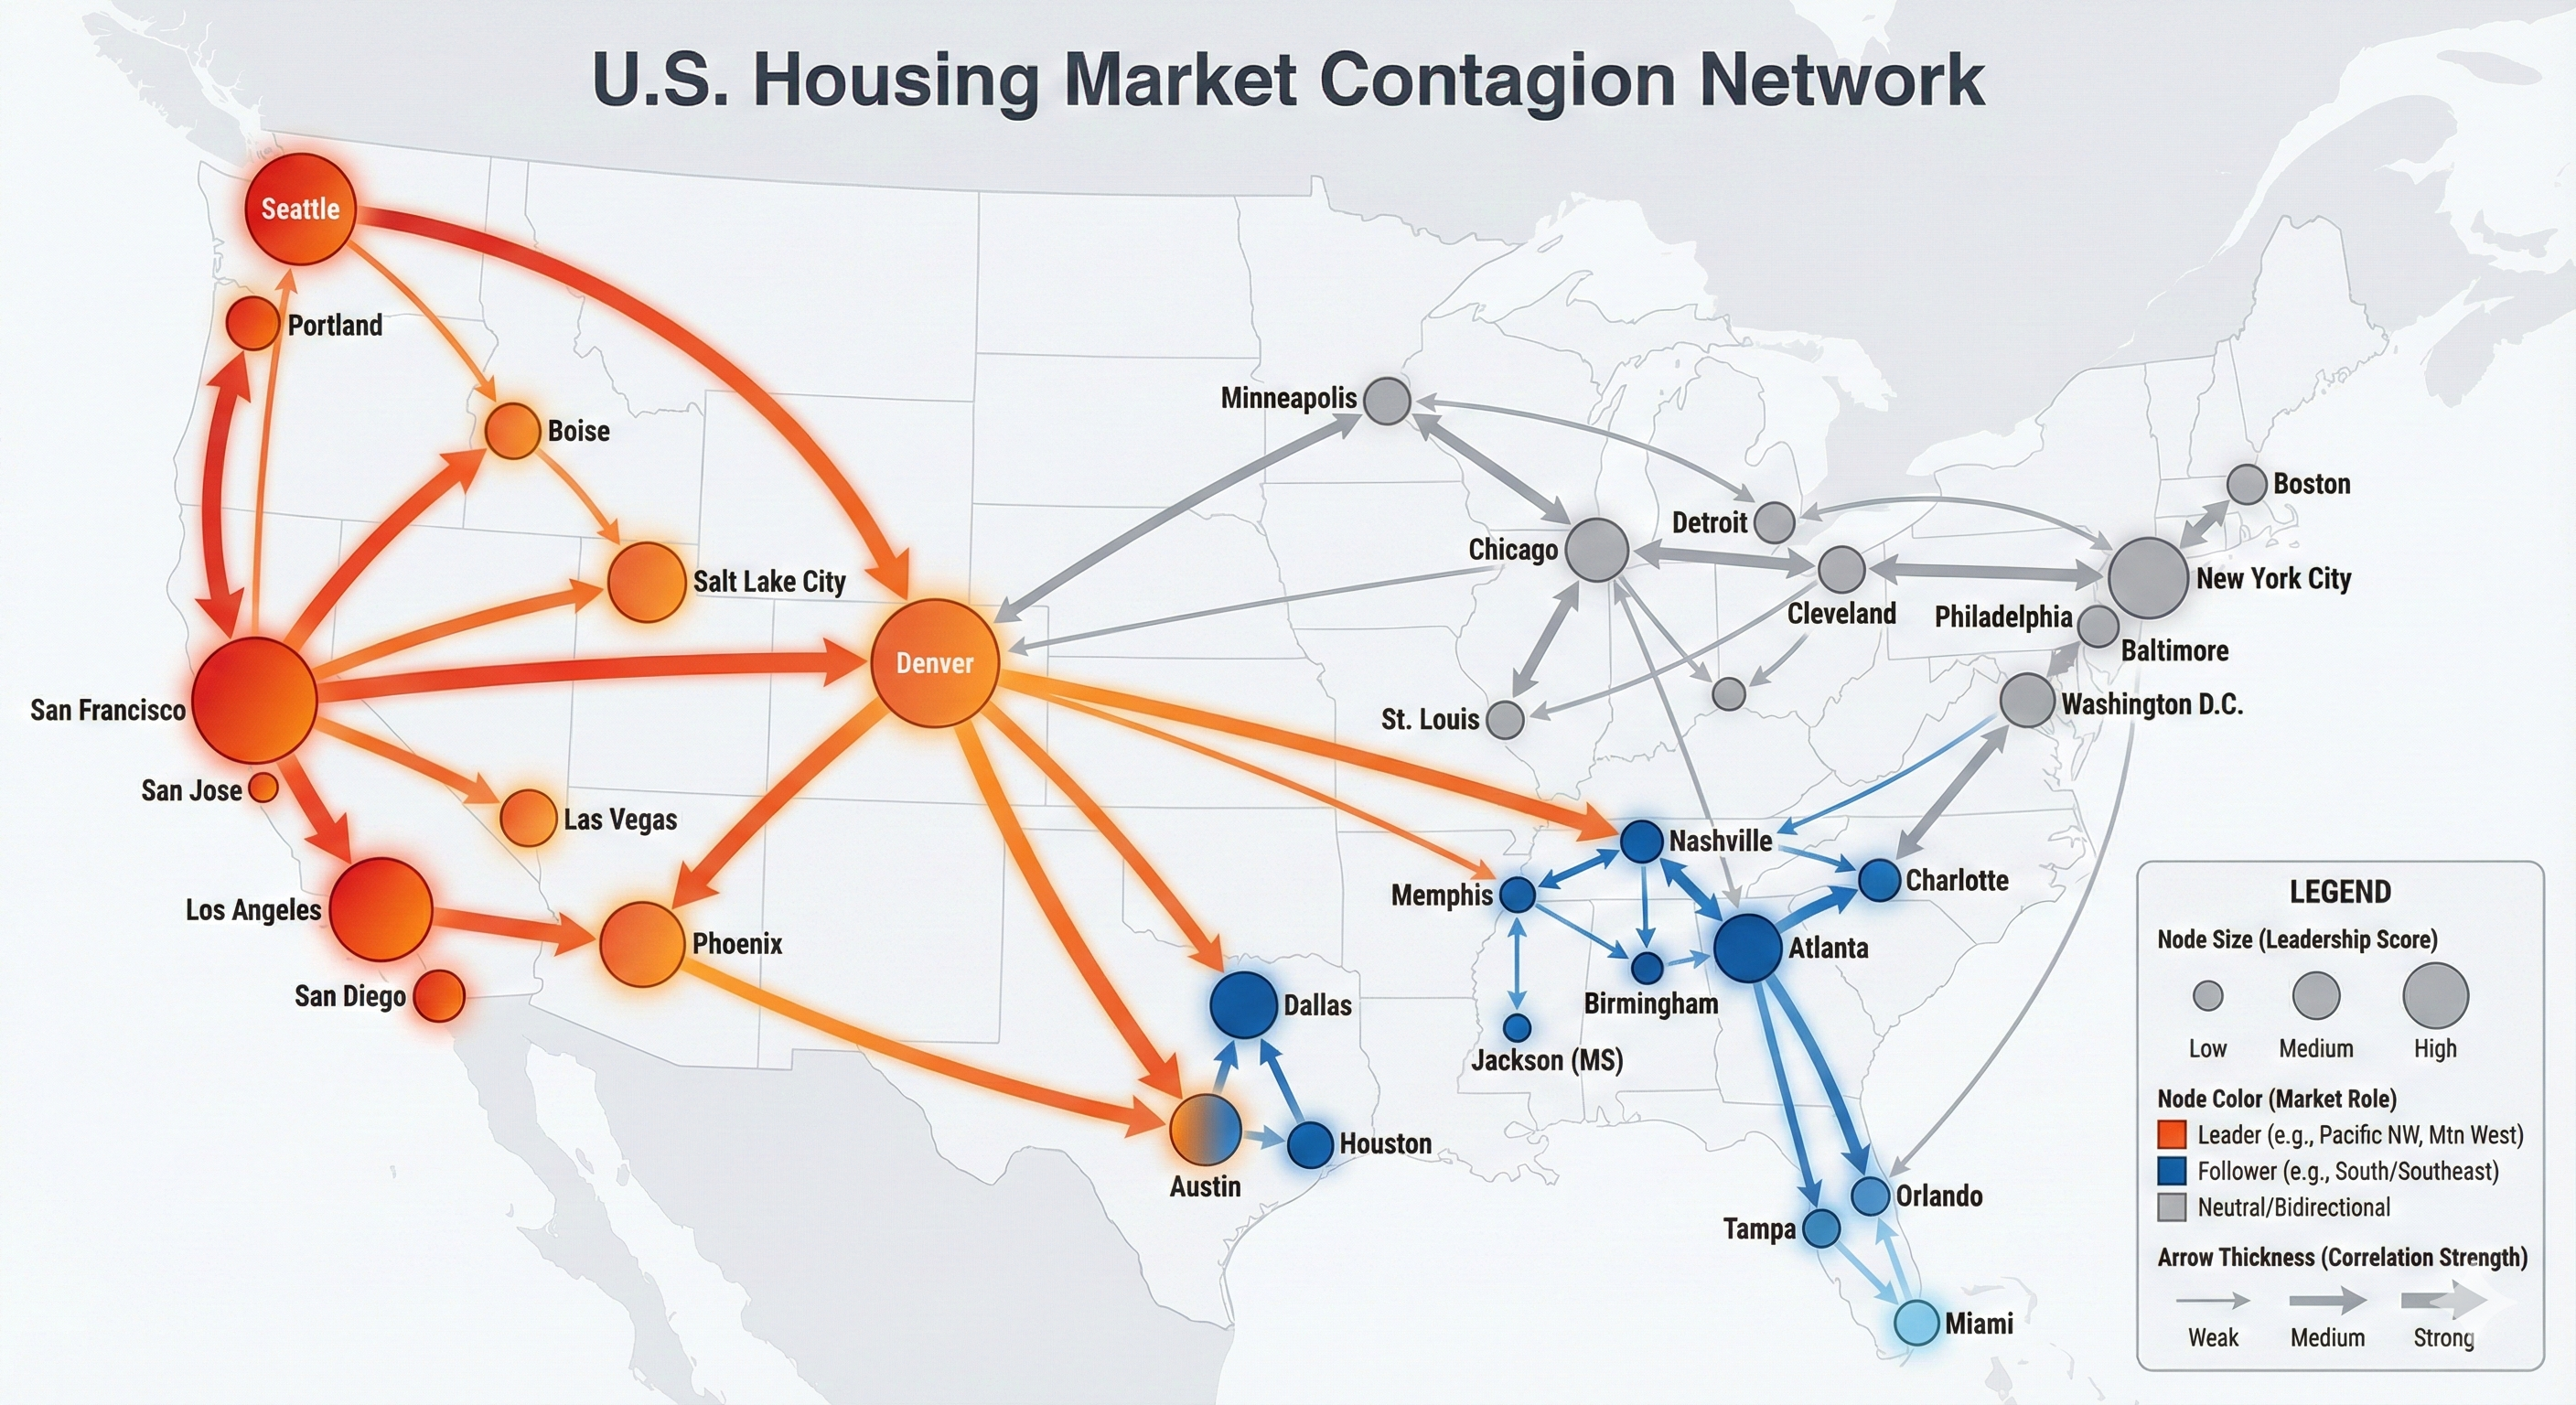
Leader & Follower Markets
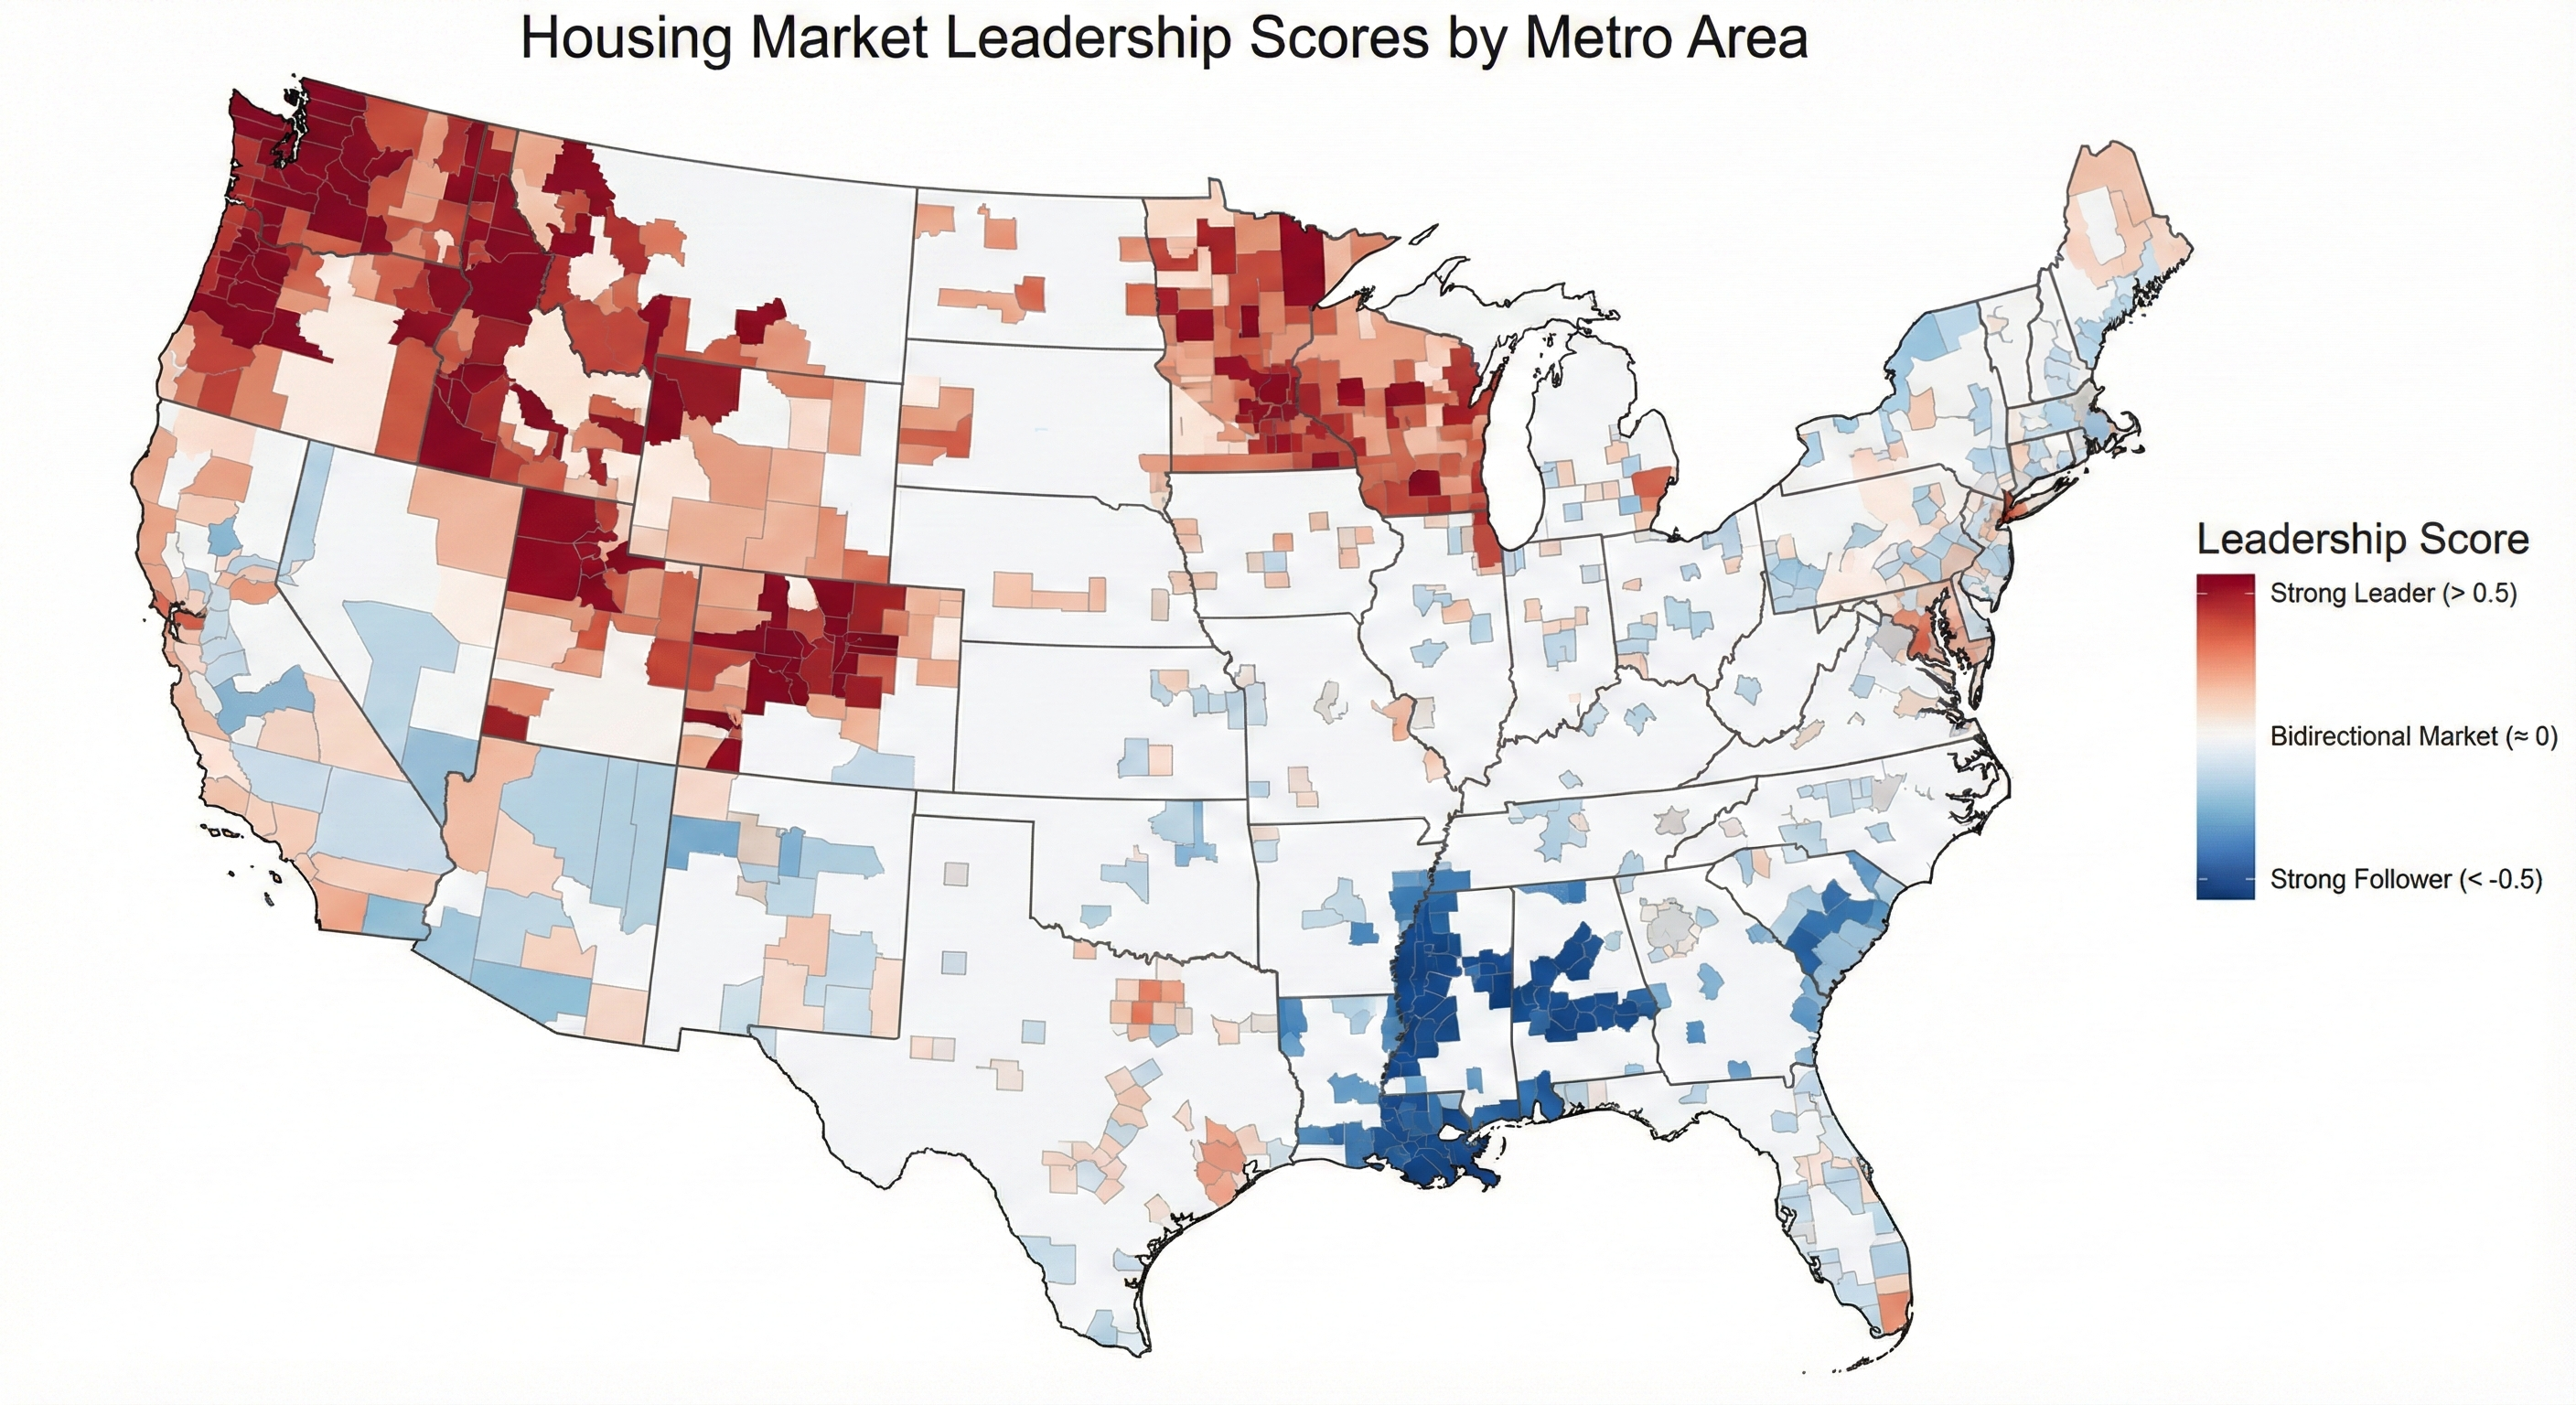
Top Leading Markets
Markets where stress appears first
Pattern: Pacific Northwest, Mountain West, Upper Midwest
Top Following Markets
Markets where stress arrives later
Pattern: Mississippi Delta, Rural South, Agricultural Economies
Anomaly Detection Results
Triaxis AI identified 12 anomalous contagion periods out of 135 months analyzed (8.9% anomaly rate), with 5 clustering around the 2022 housing correction.
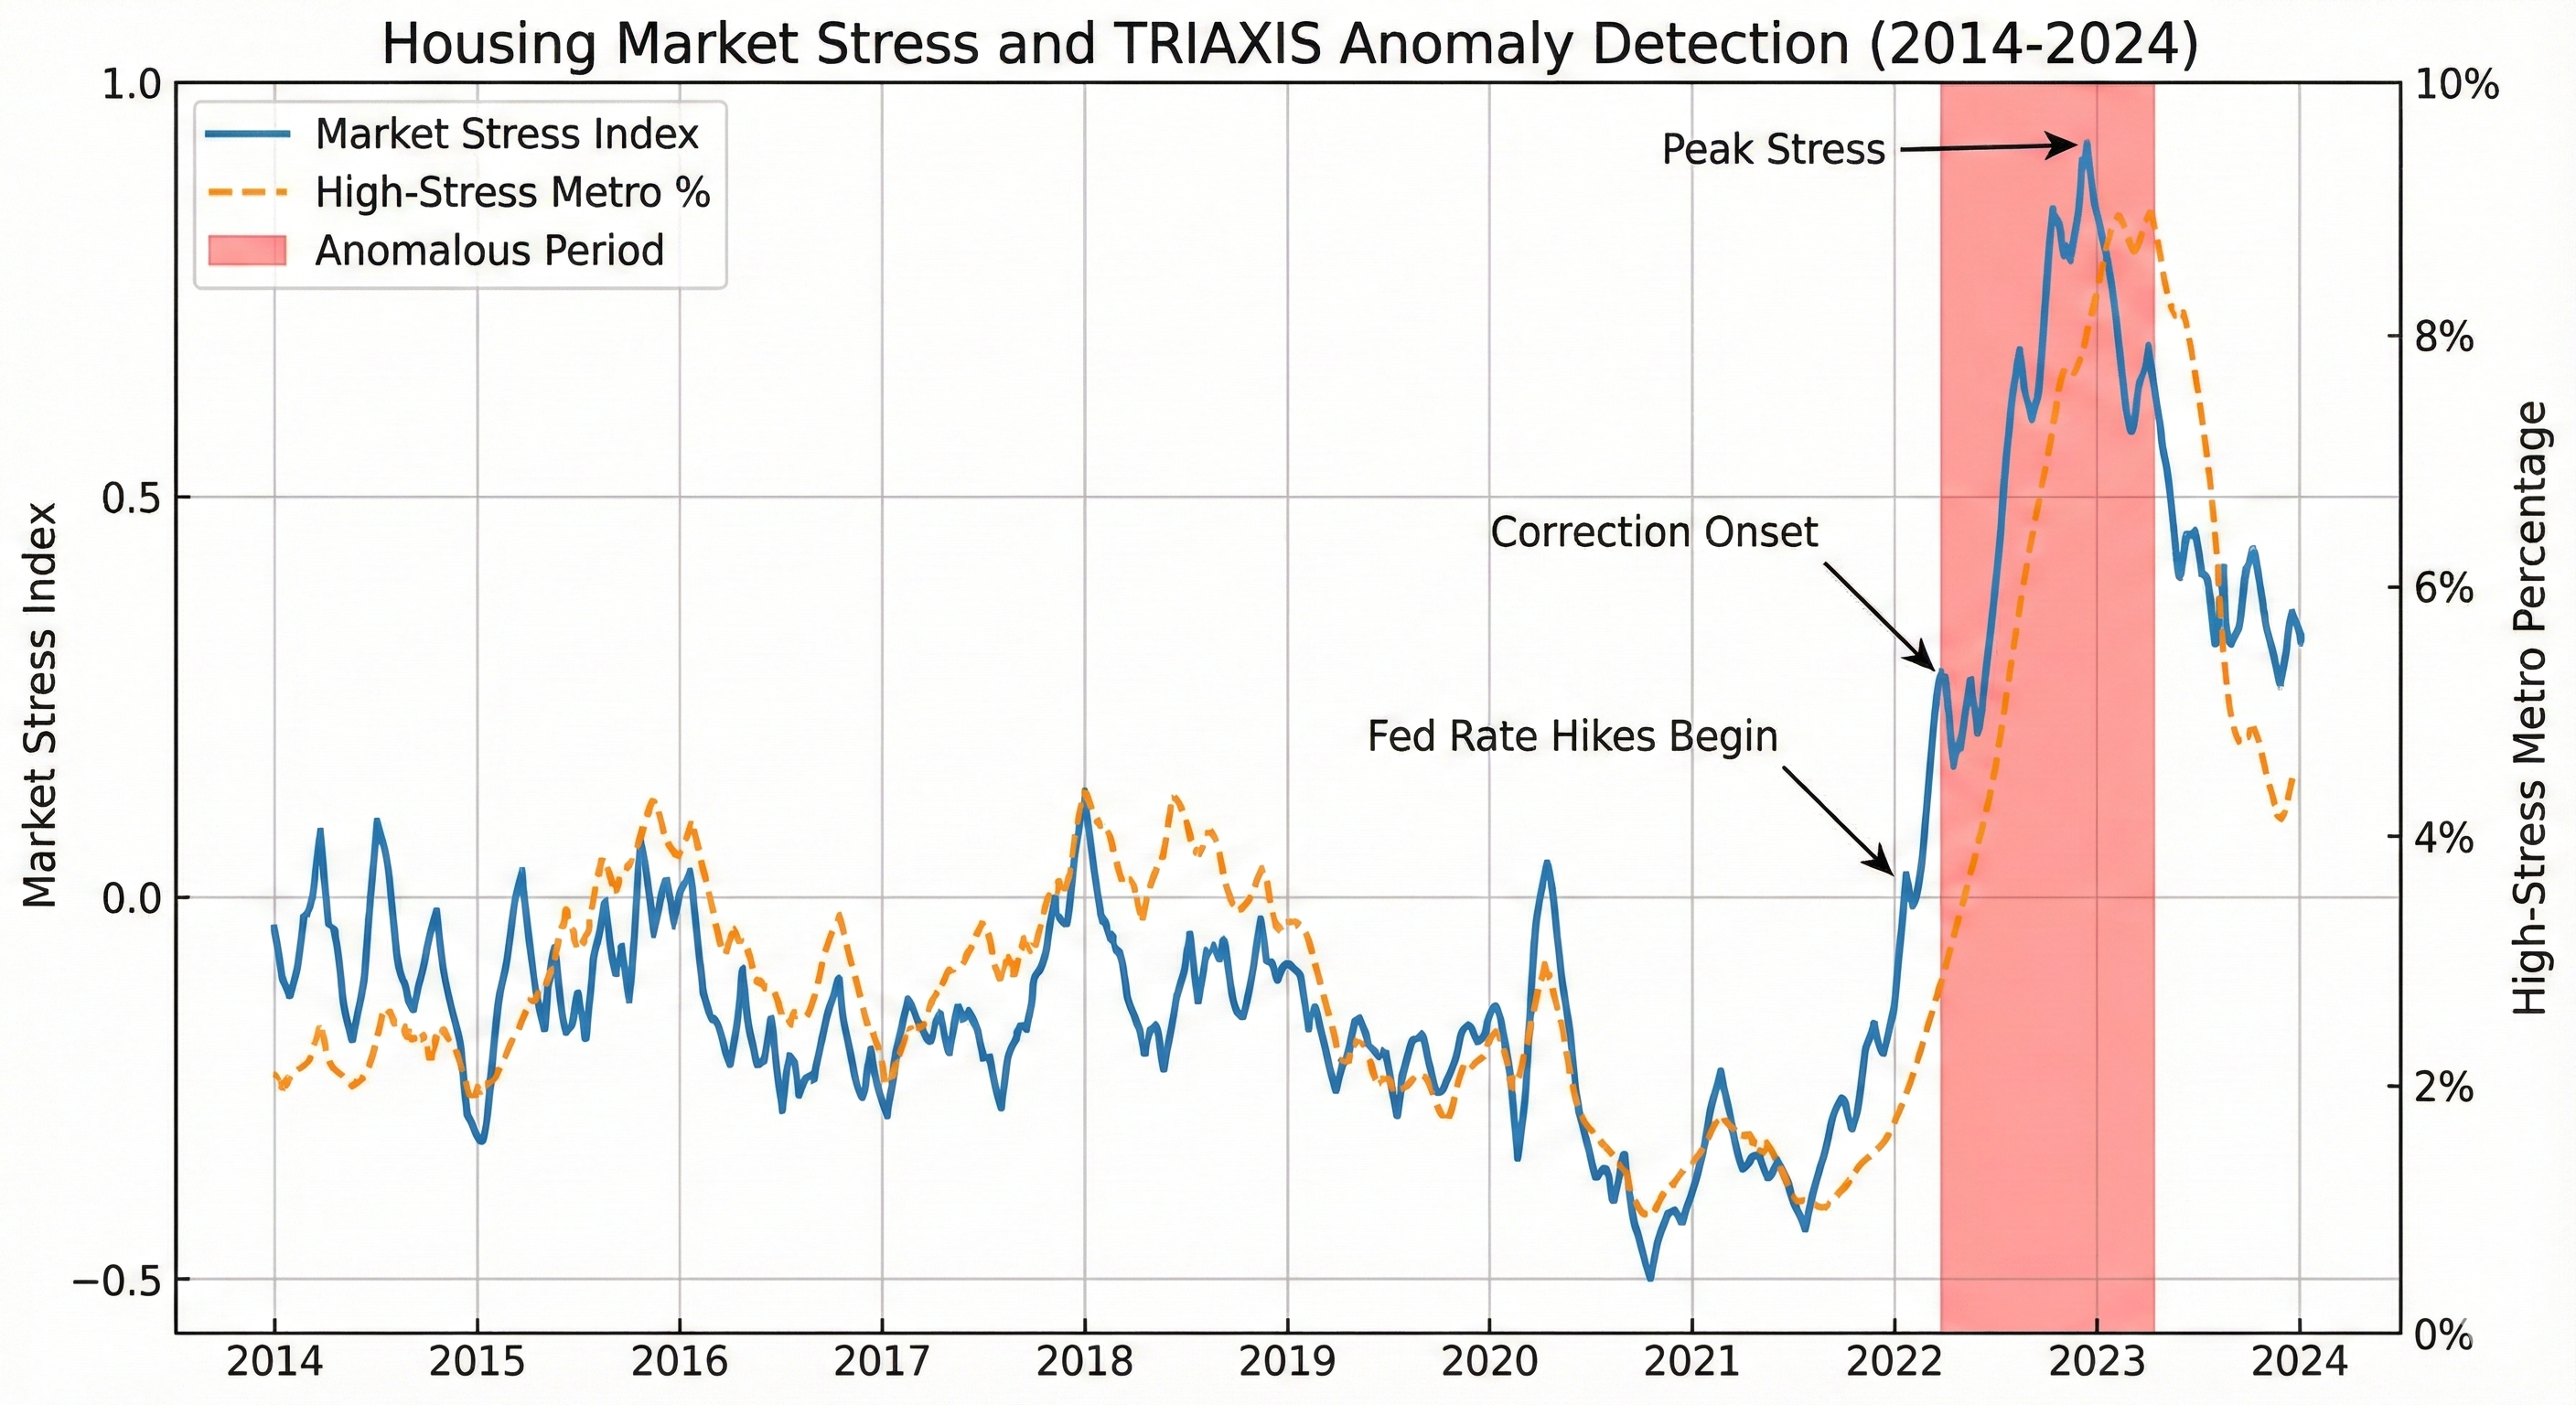
Critical Finding: 2022 Housing Correction
Five of the 12 anomalous periods clustered in the 8-month window from June 2022 to January 2023, coinciding precisely with the housing market correction following Federal Reserve rate increases.
Early Warning System
Practical applications for investors, lenders, and policymakers with an average 1.7-month early warning window.
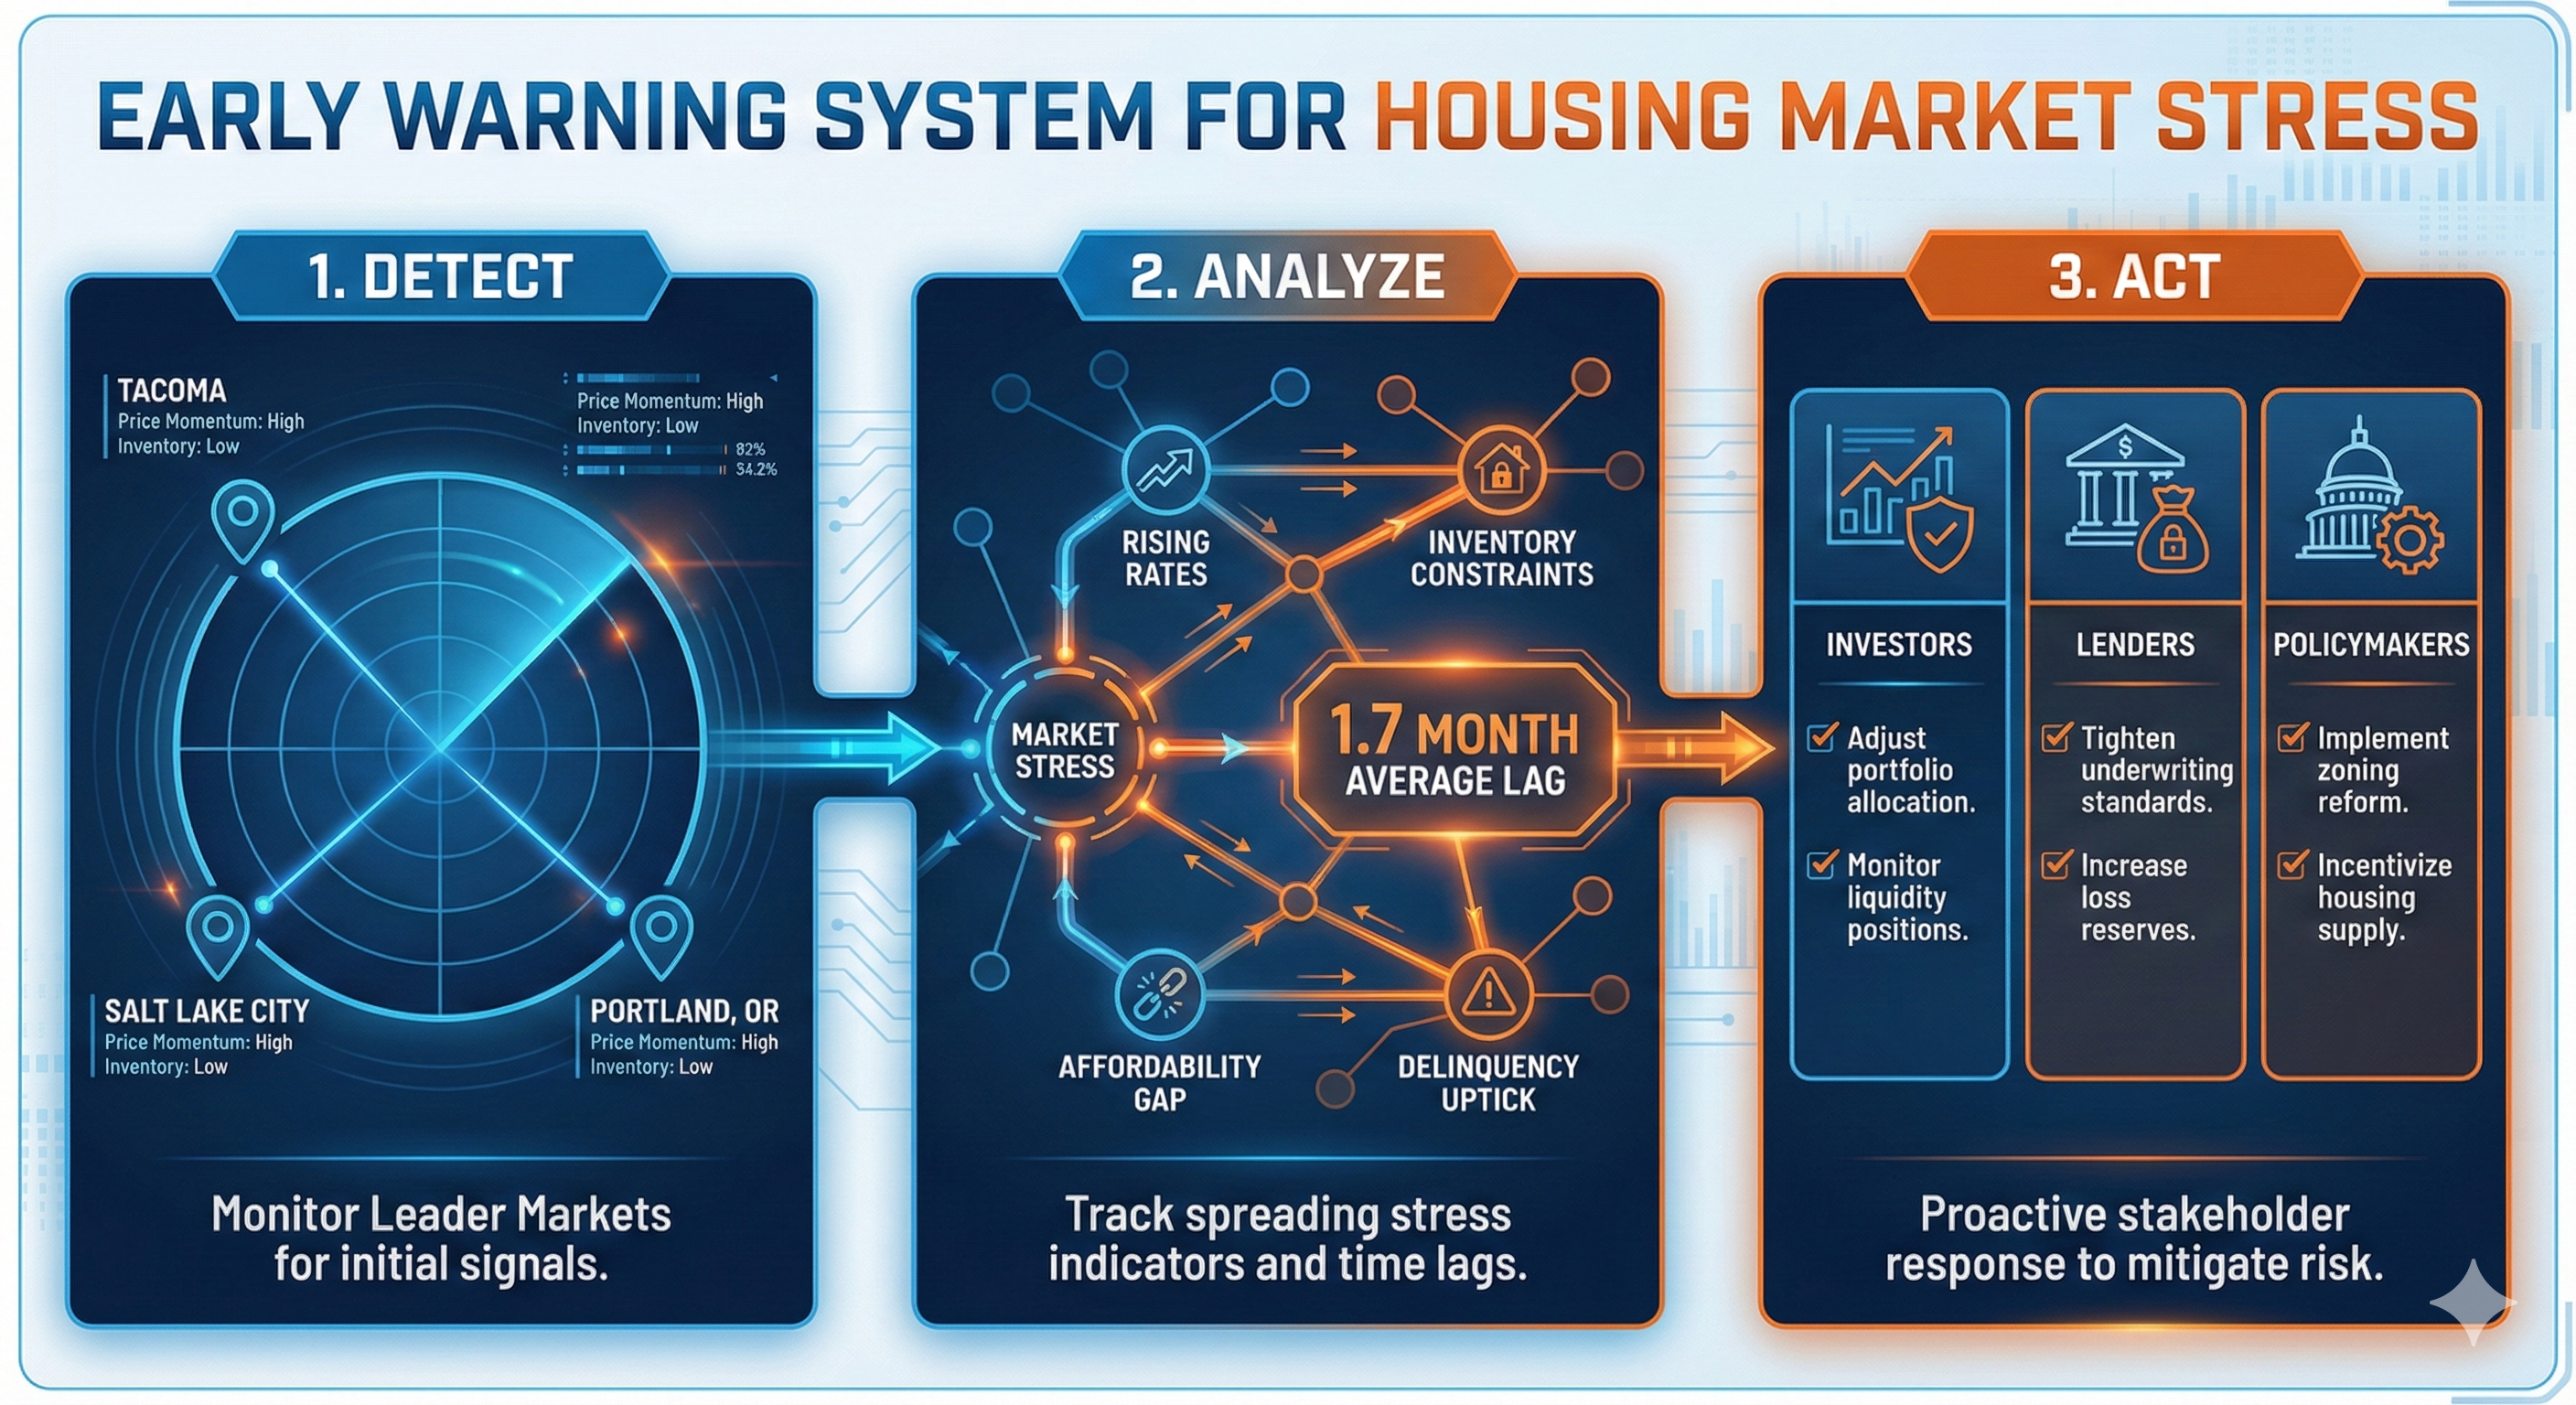
For Investors
- - Monitor Pacific Northwest/Mountain West for early signals
- - 1.7-month warning before stress spreads
- - Follower markets offer delayed exposure opportunities
For Lenders
- - Geographic concentration risk assessment
- - Early warning for portfolio stress testing
- - Targeted underwriting adjustments
For Policymakers
- - Intervention in leader markets could slow spread
- - Resource allocation based on expected timing
- - Macroprudential policy calibration
Key Findings
Housing stress spreads geographically
With identifiable leader-follower relationships among metropolitan areas
Average transmission lag is 1.7 months
Providing a meaningful early warning window for following markets
Clear geographic patterns emerge
Pacific Northwest, Mountain West lead; Rural South follows
Triaxis AI successfully detected 2022 correction
Anomalies clustered precisely during the stress propagation period
What This Research Actually Demonstrates
At its core, this paper validates the detection of stress propagation across networked nodes with identifiable leader-follower relationships. Any system where problems spread geographically or through connected networks shares this structure.
The Pattern We Detected
- - Leader-follower propagation sequences
- - Measurable transmission lag times
- - Geographic clustering of stress
- - Early warning through network position
Systems With Similar Structure
- - Supply chain disruption propagation
- - Disease outbreak geographic spread
- - Power grid cascading failures
- - Sentiment/reputation contagion
- - Wildfire or environmental spread modeling
The common thread: Any network where stress, failure, or change propagates from node to node with measurable delay can benefit from contagion detection. If you can identify the leaders, you gain early warning for the followers.
Want the Full Research?
Request the complete whitepaper with detailed methodology, full data tables, and reproducibility code.