Two-Pass Behavioral Regime Detection in Formula 1
Per-Driver Analysis + Fleet-Level Peer Dynamics Using Geometric Anomaly Detection
Using 48-dimensional telemetry data from the 2022 Monaco Grand Prix, we analyzed all 20 drivers to answer two questions: When does a driver deviate from their OWN baseline? And when does their pattern diverge from PEERS? The results revealed a surprising discovery - adding context REVEALS anomalies rather than explaining them away.
Watch the Explainer
A brief walkthrough of this F1 telemetry analysis and its key discoveries
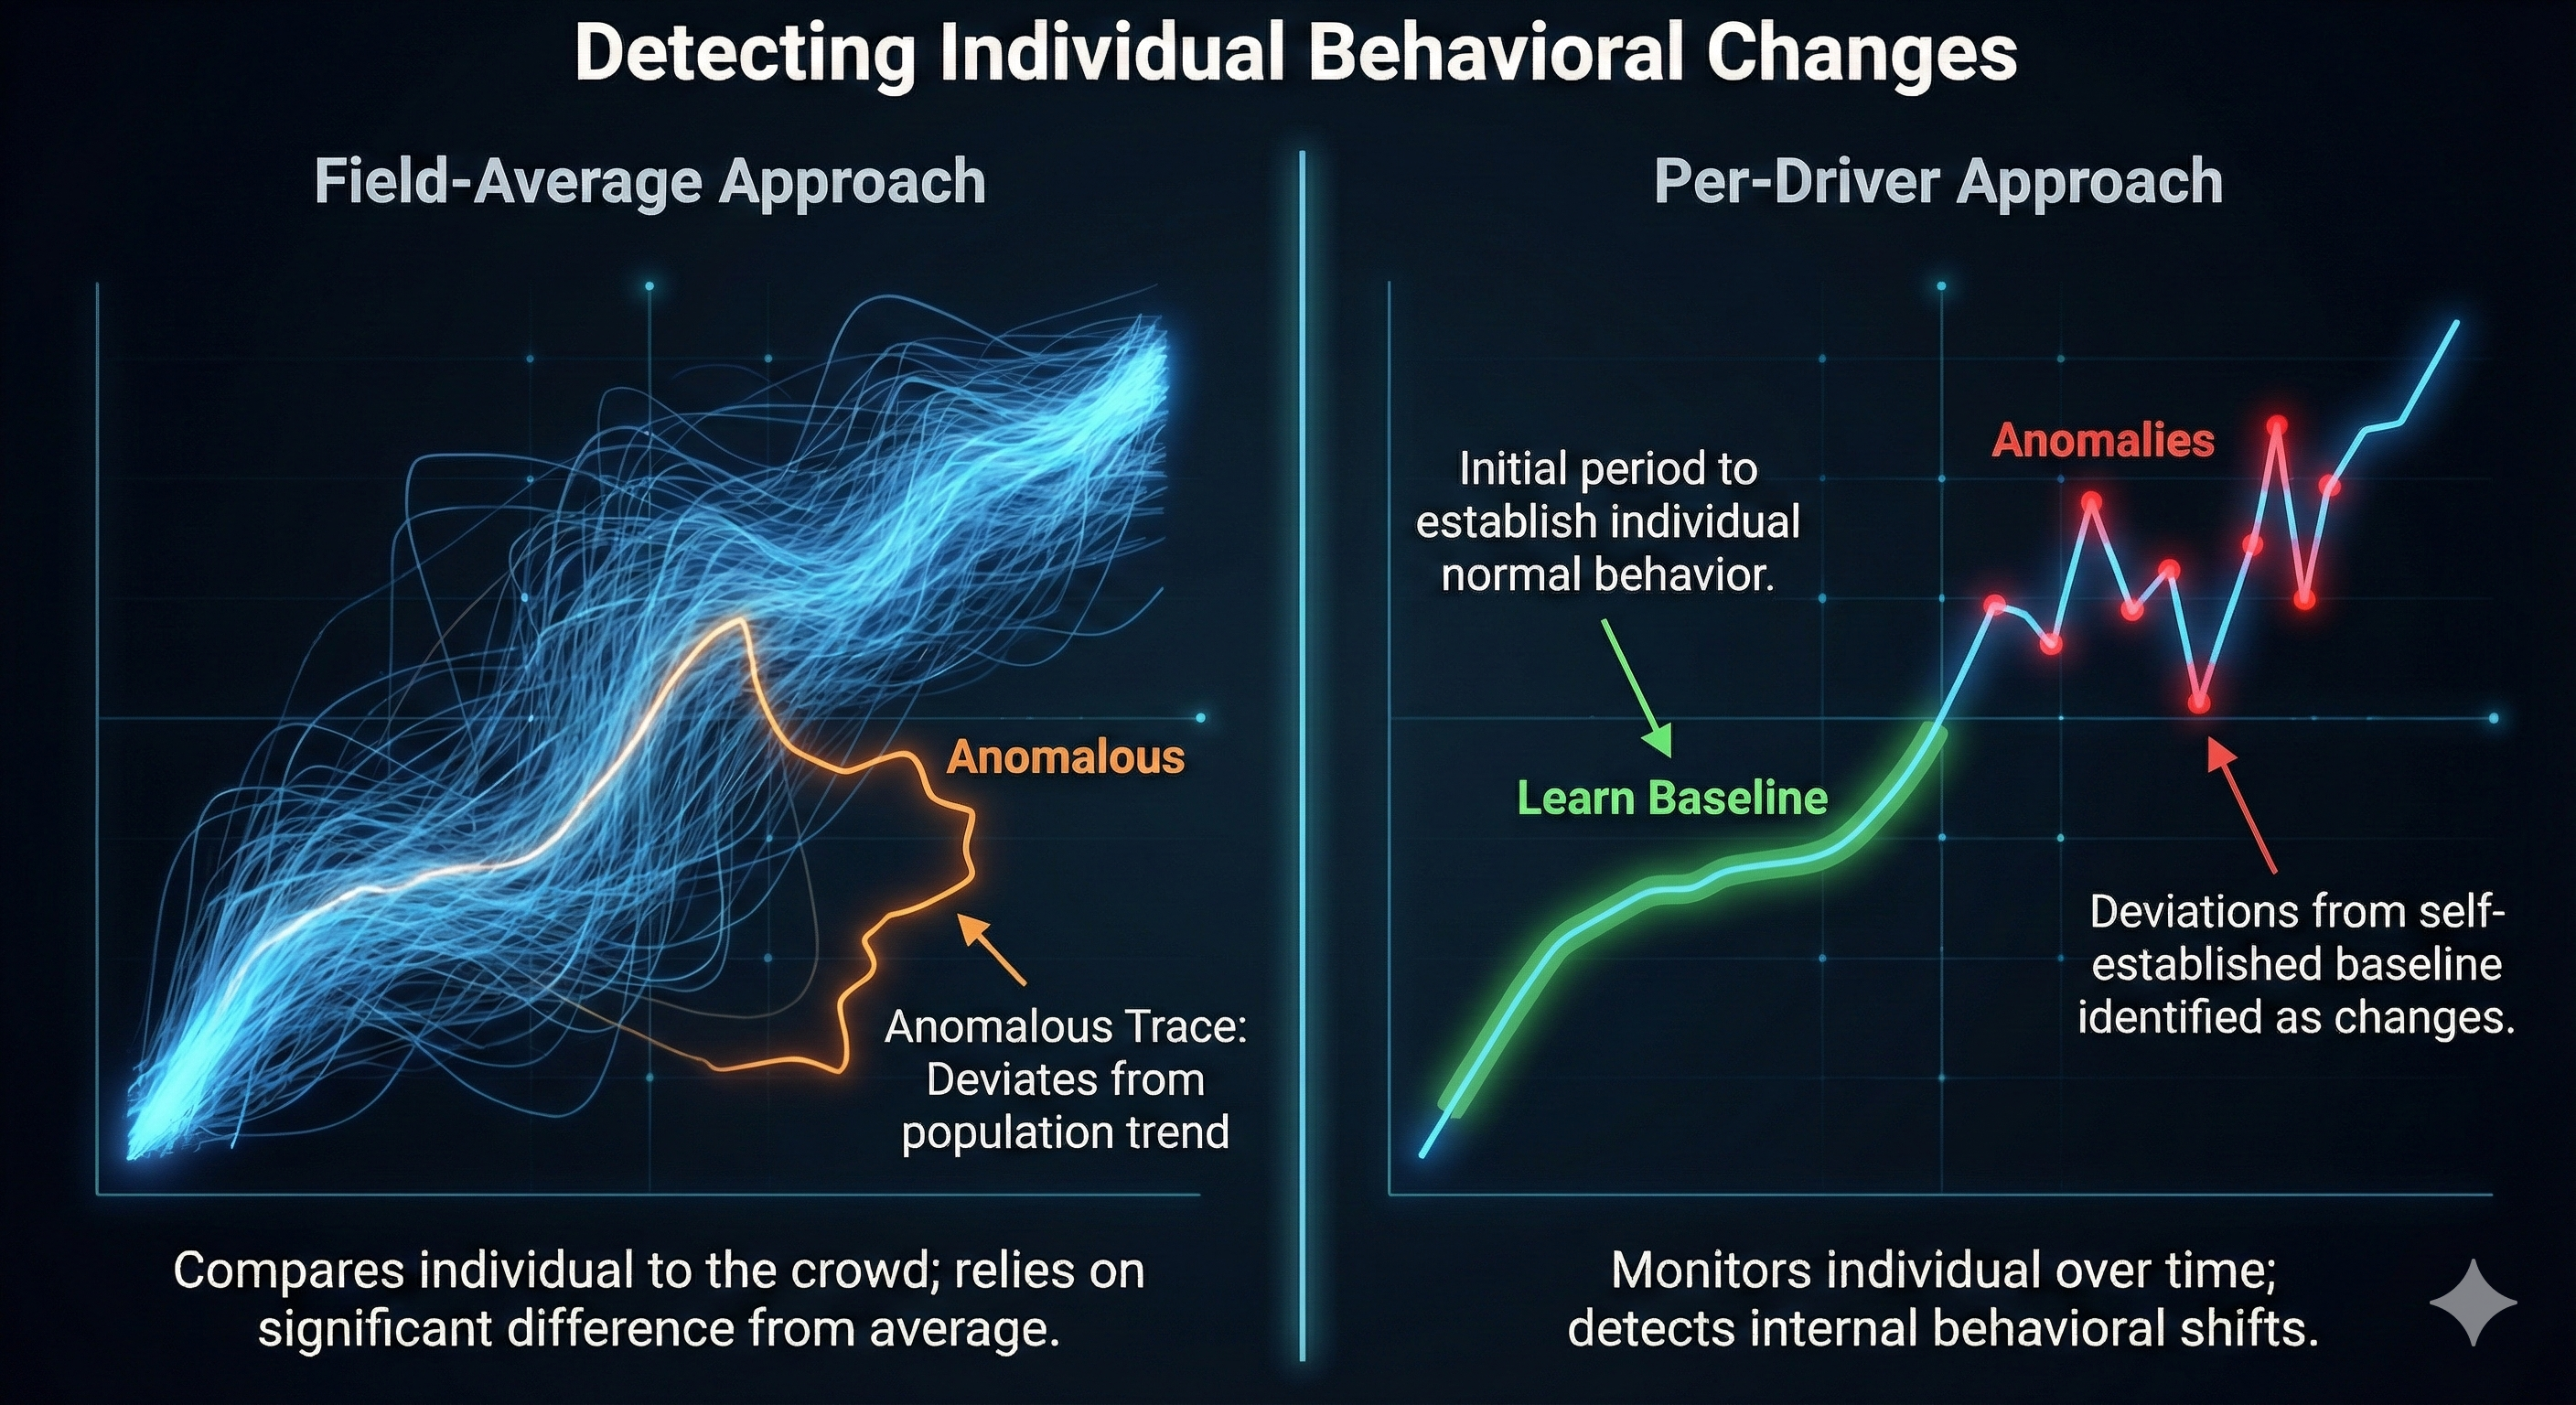
Why Single-Pass Analysis Falls Short
Traditional approaches force a choice: compare entities to a field average (which penalizes unique styles) or analyze individuals in isolation (which misses peer dynamics). Neither alone tells the full story.
| Single-Pass Approach | What It Measures | Problem |
|---|---|---|
| Compare to fleet mean | How different from others? | Penalizes unique styles |
| Cluster raw telemetry | Which entities are similar? | Dominated by speed/position |
| Individual analysis only | Did this entity change? | Misses peer dynamics |
The Two-Pass Architecture
The solution is to ask both questions sequentially, using the output of Pass 1 as input to Pass 2:
Pass 1: Per-Entity Analysis
"Is this entity behaving unusually for THEMSELVES?"
- Learn each entity's individual baseline (30% of data)
- Score remaining 70% against THEIR baseline
- Output: anomaly_rate, anomaly_timing, consistency_score
Pass 2: Fleet Meta-Analysis
"Is this entity's pattern unusual relative to PEERS?"
- Build meta-vectors from Pass 1 outputs + behavioral features
- Run Triaxis AI on meta-vectors
- Discover: peer cohorts, global regimes, local deviations
The key insight: Pass 1 outputs become Pass 2 inputs. The anomaly rates, timing patterns, and consistency scores from individual analysis become features for discovering fleet-level patterns.
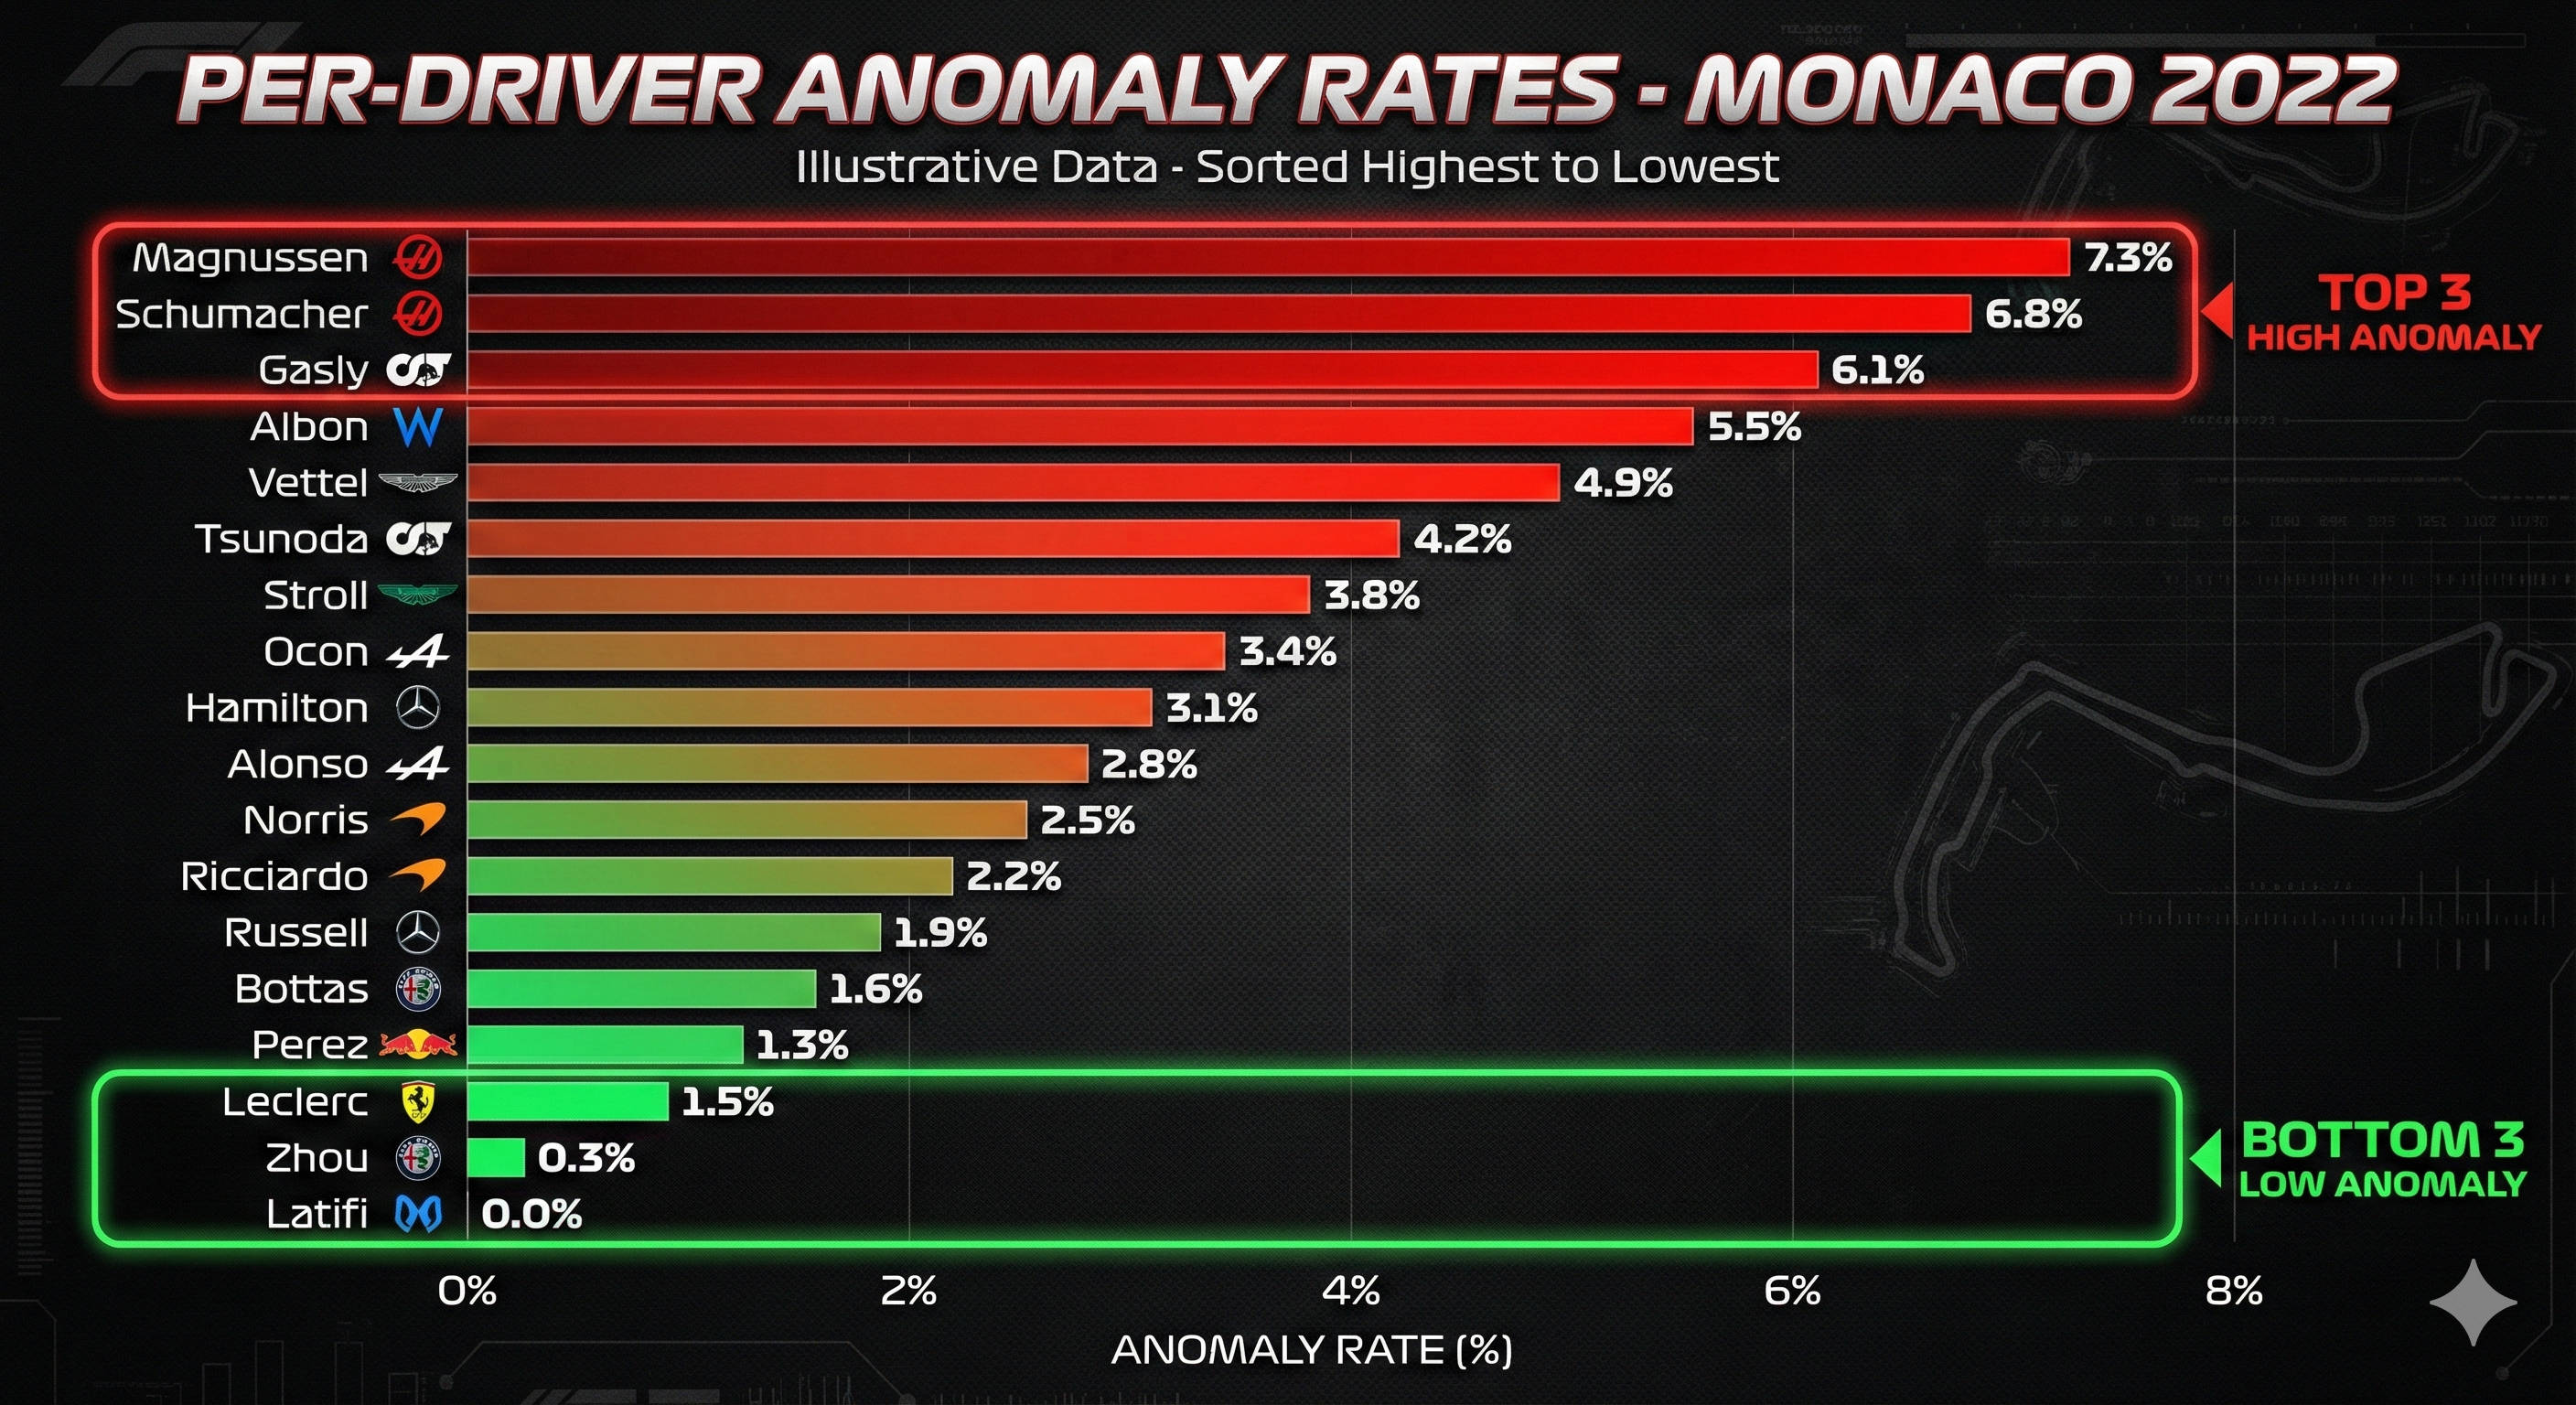
Pass 1 Results: Per-Driver Analysis
Processing Performance
Critical Discovery: Late-Race Anomaly Accumulation
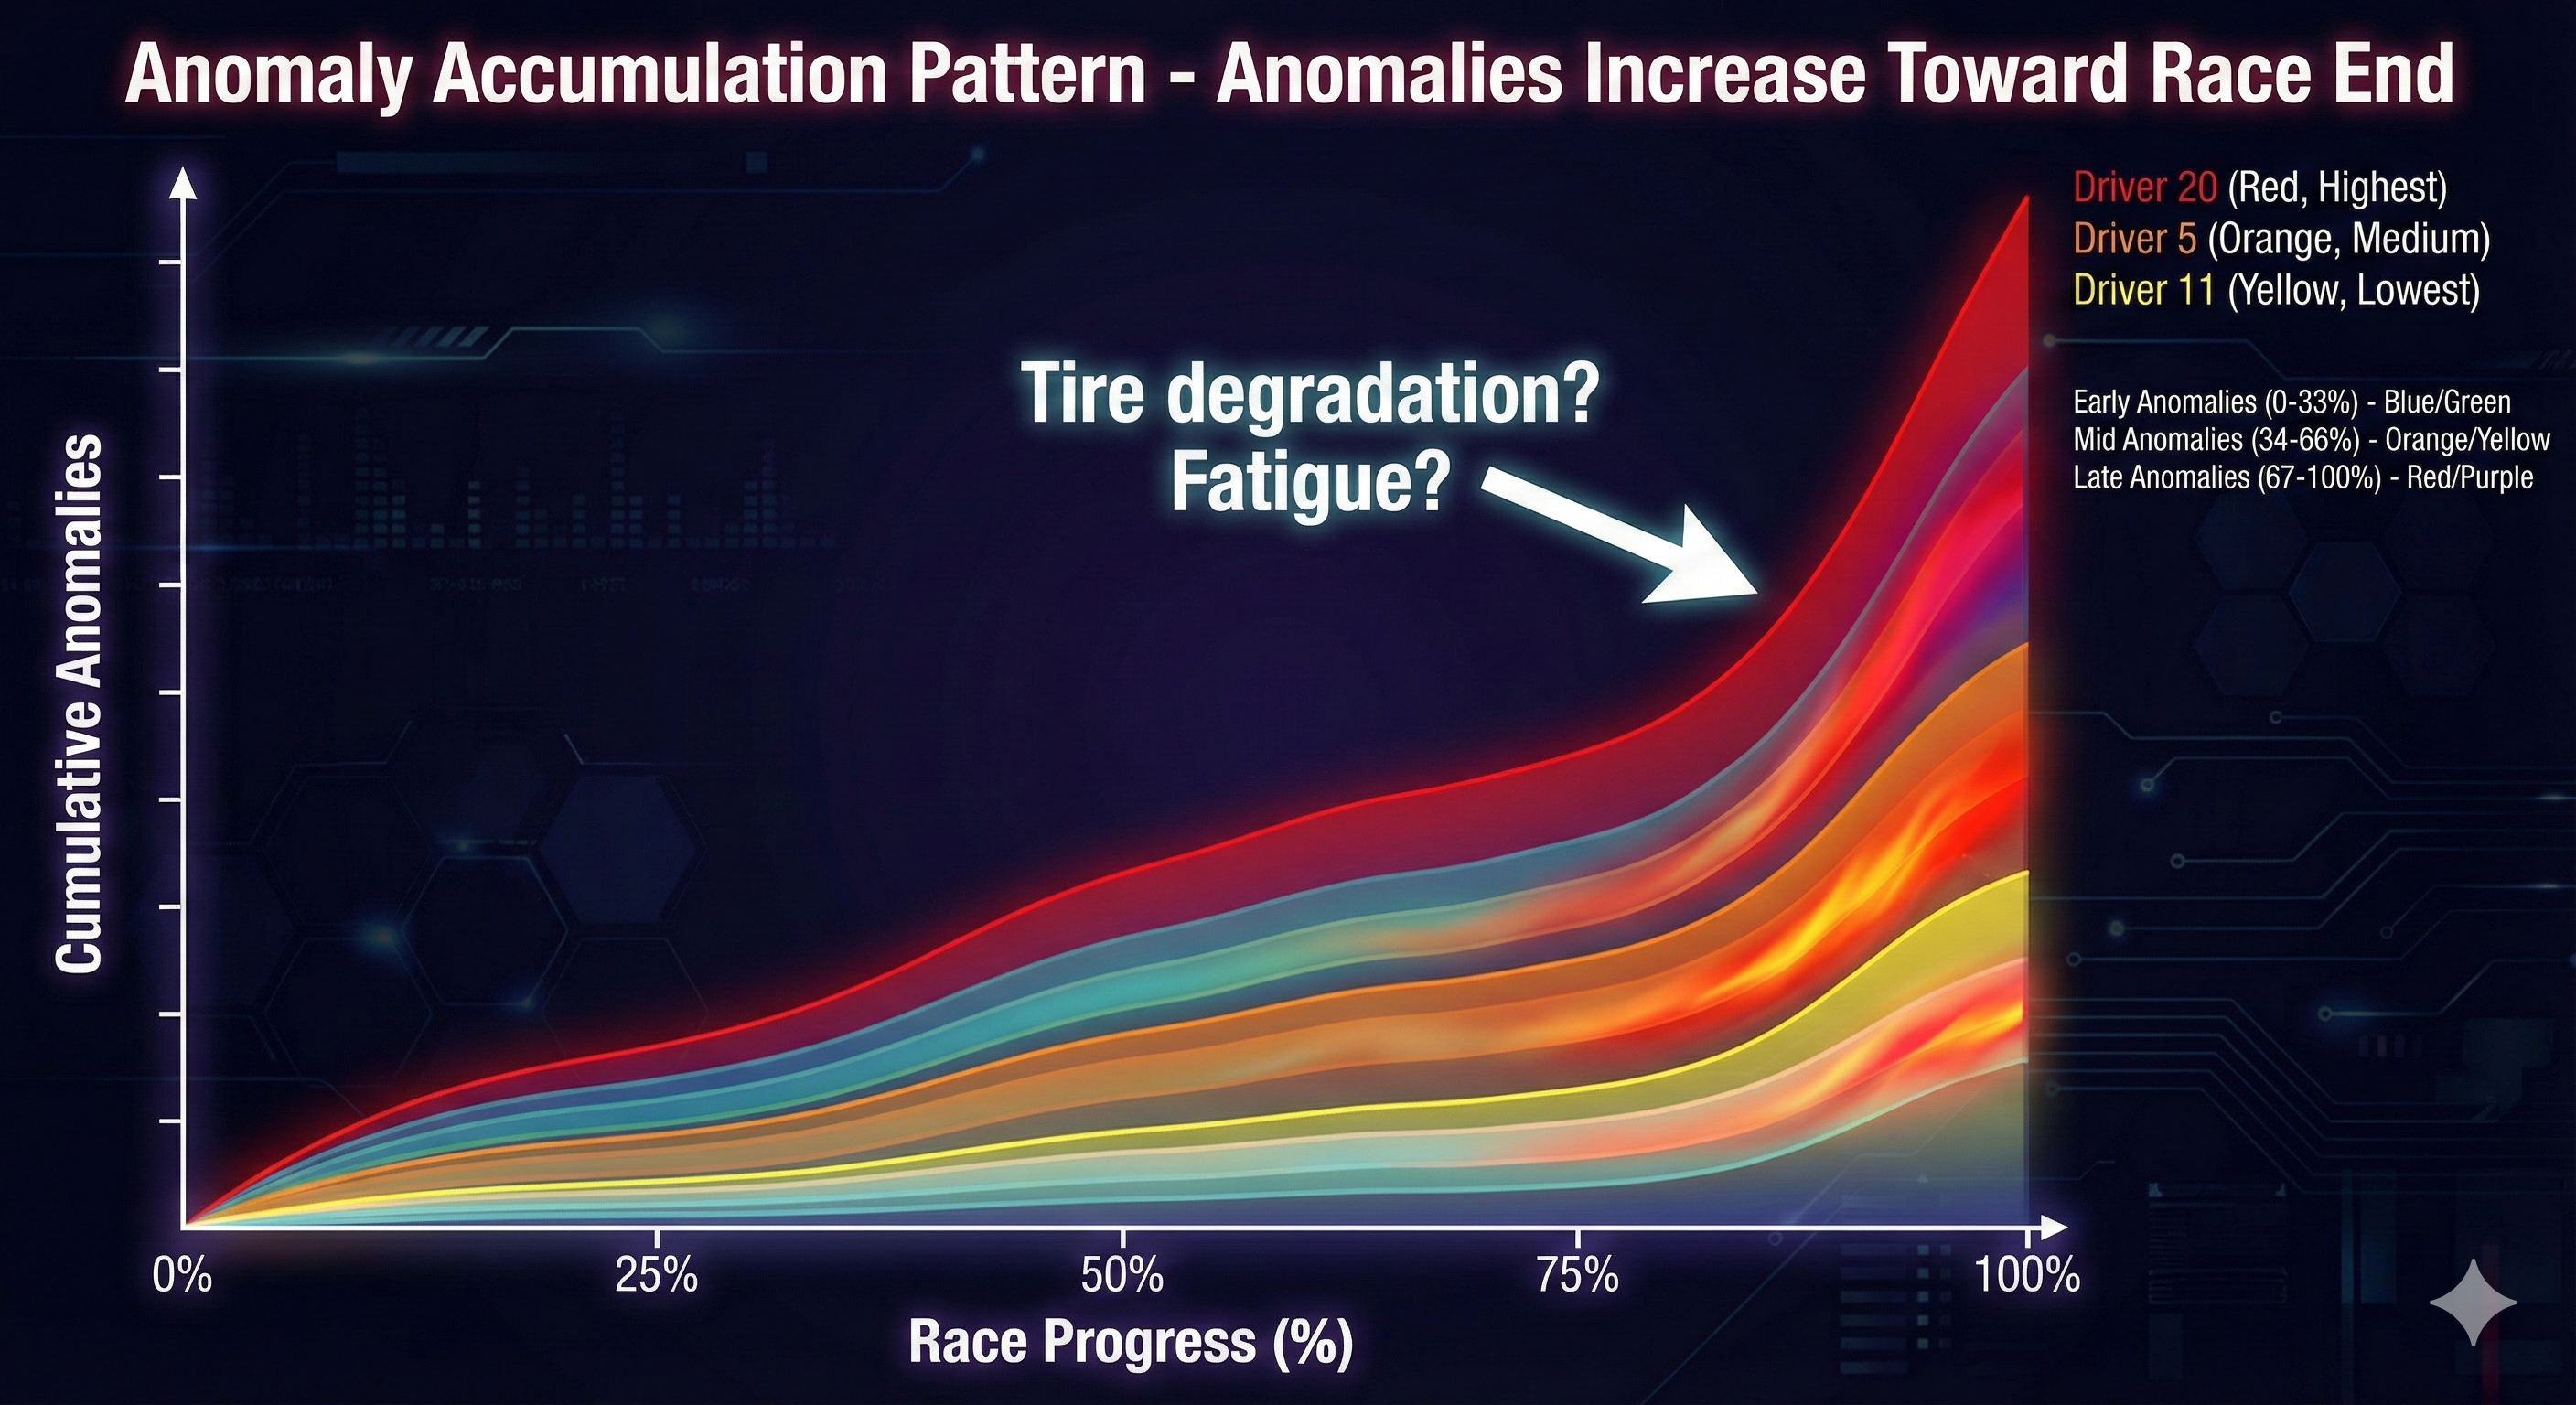
Driver 20 (Magnussen) showed a 7.6x increase in anomalies from early to late race - likely reflecting tire degradation, fuel burn, and fatigue.
Pass 2 Results: The Surprising Discovery
189 meta-vectors (20 drivers x ~9 time windows) were analyzed in two modes. The results were opposite to what we expected:
| Analysis Mode | Fleet Anomalies | Global Regimes | Local Deviations |
|---|---|---|---|
| Mode A (Blind - no position) | 13 (9.8%) | 1 | 1 |
| Mode B (Context-aware + position) | 40 (30.1%) | 4 | 0 |
Critical Finding: Context REVEALS Anomalies
Mode B detected 3x MORE anomalies than Mode A. This is the opposite of what we naively expected!
We expected: Adding position context would EXPLAIN behavioral differences (fewer anomalies).
What happened: Context REVEALED that many "normal-looking" behaviors were actually contextually inappropriate.
Why Mode B Found 3x More Anomalies
| Scenario | Mode A (Blind) | Mode B (Context) |
|---|---|---|
| P1 car conserving tires | "Normal - matches mid-pack" | "Anomalous - should be pushing" |
| P20 car pushing hard | "Normal - matches front-runner" | "Anomalous - why risk it?" |
| Similar behaviors, different contexts | "Same cohort" | "Contextually inappropriate" |
Global Regime Changes
When >30% of fleet shifts together
Context exposed hidden fleet-wide shifts
Local Deviations
Single entity diverges while fleet stable
Context absorbed individual anomalies into fleet patterns
Mode B's 4 global regime changes reveal fleet-wide behavioral shifts
Moments when many drivers were behaving unusually FOR THEIR SITUATION, not just unusually in absolute terms.
The Latifi Paradox: Consistent But Different
Driver 6 (Latifi) presents a fascinating case that illustrates why both passes are necessary:
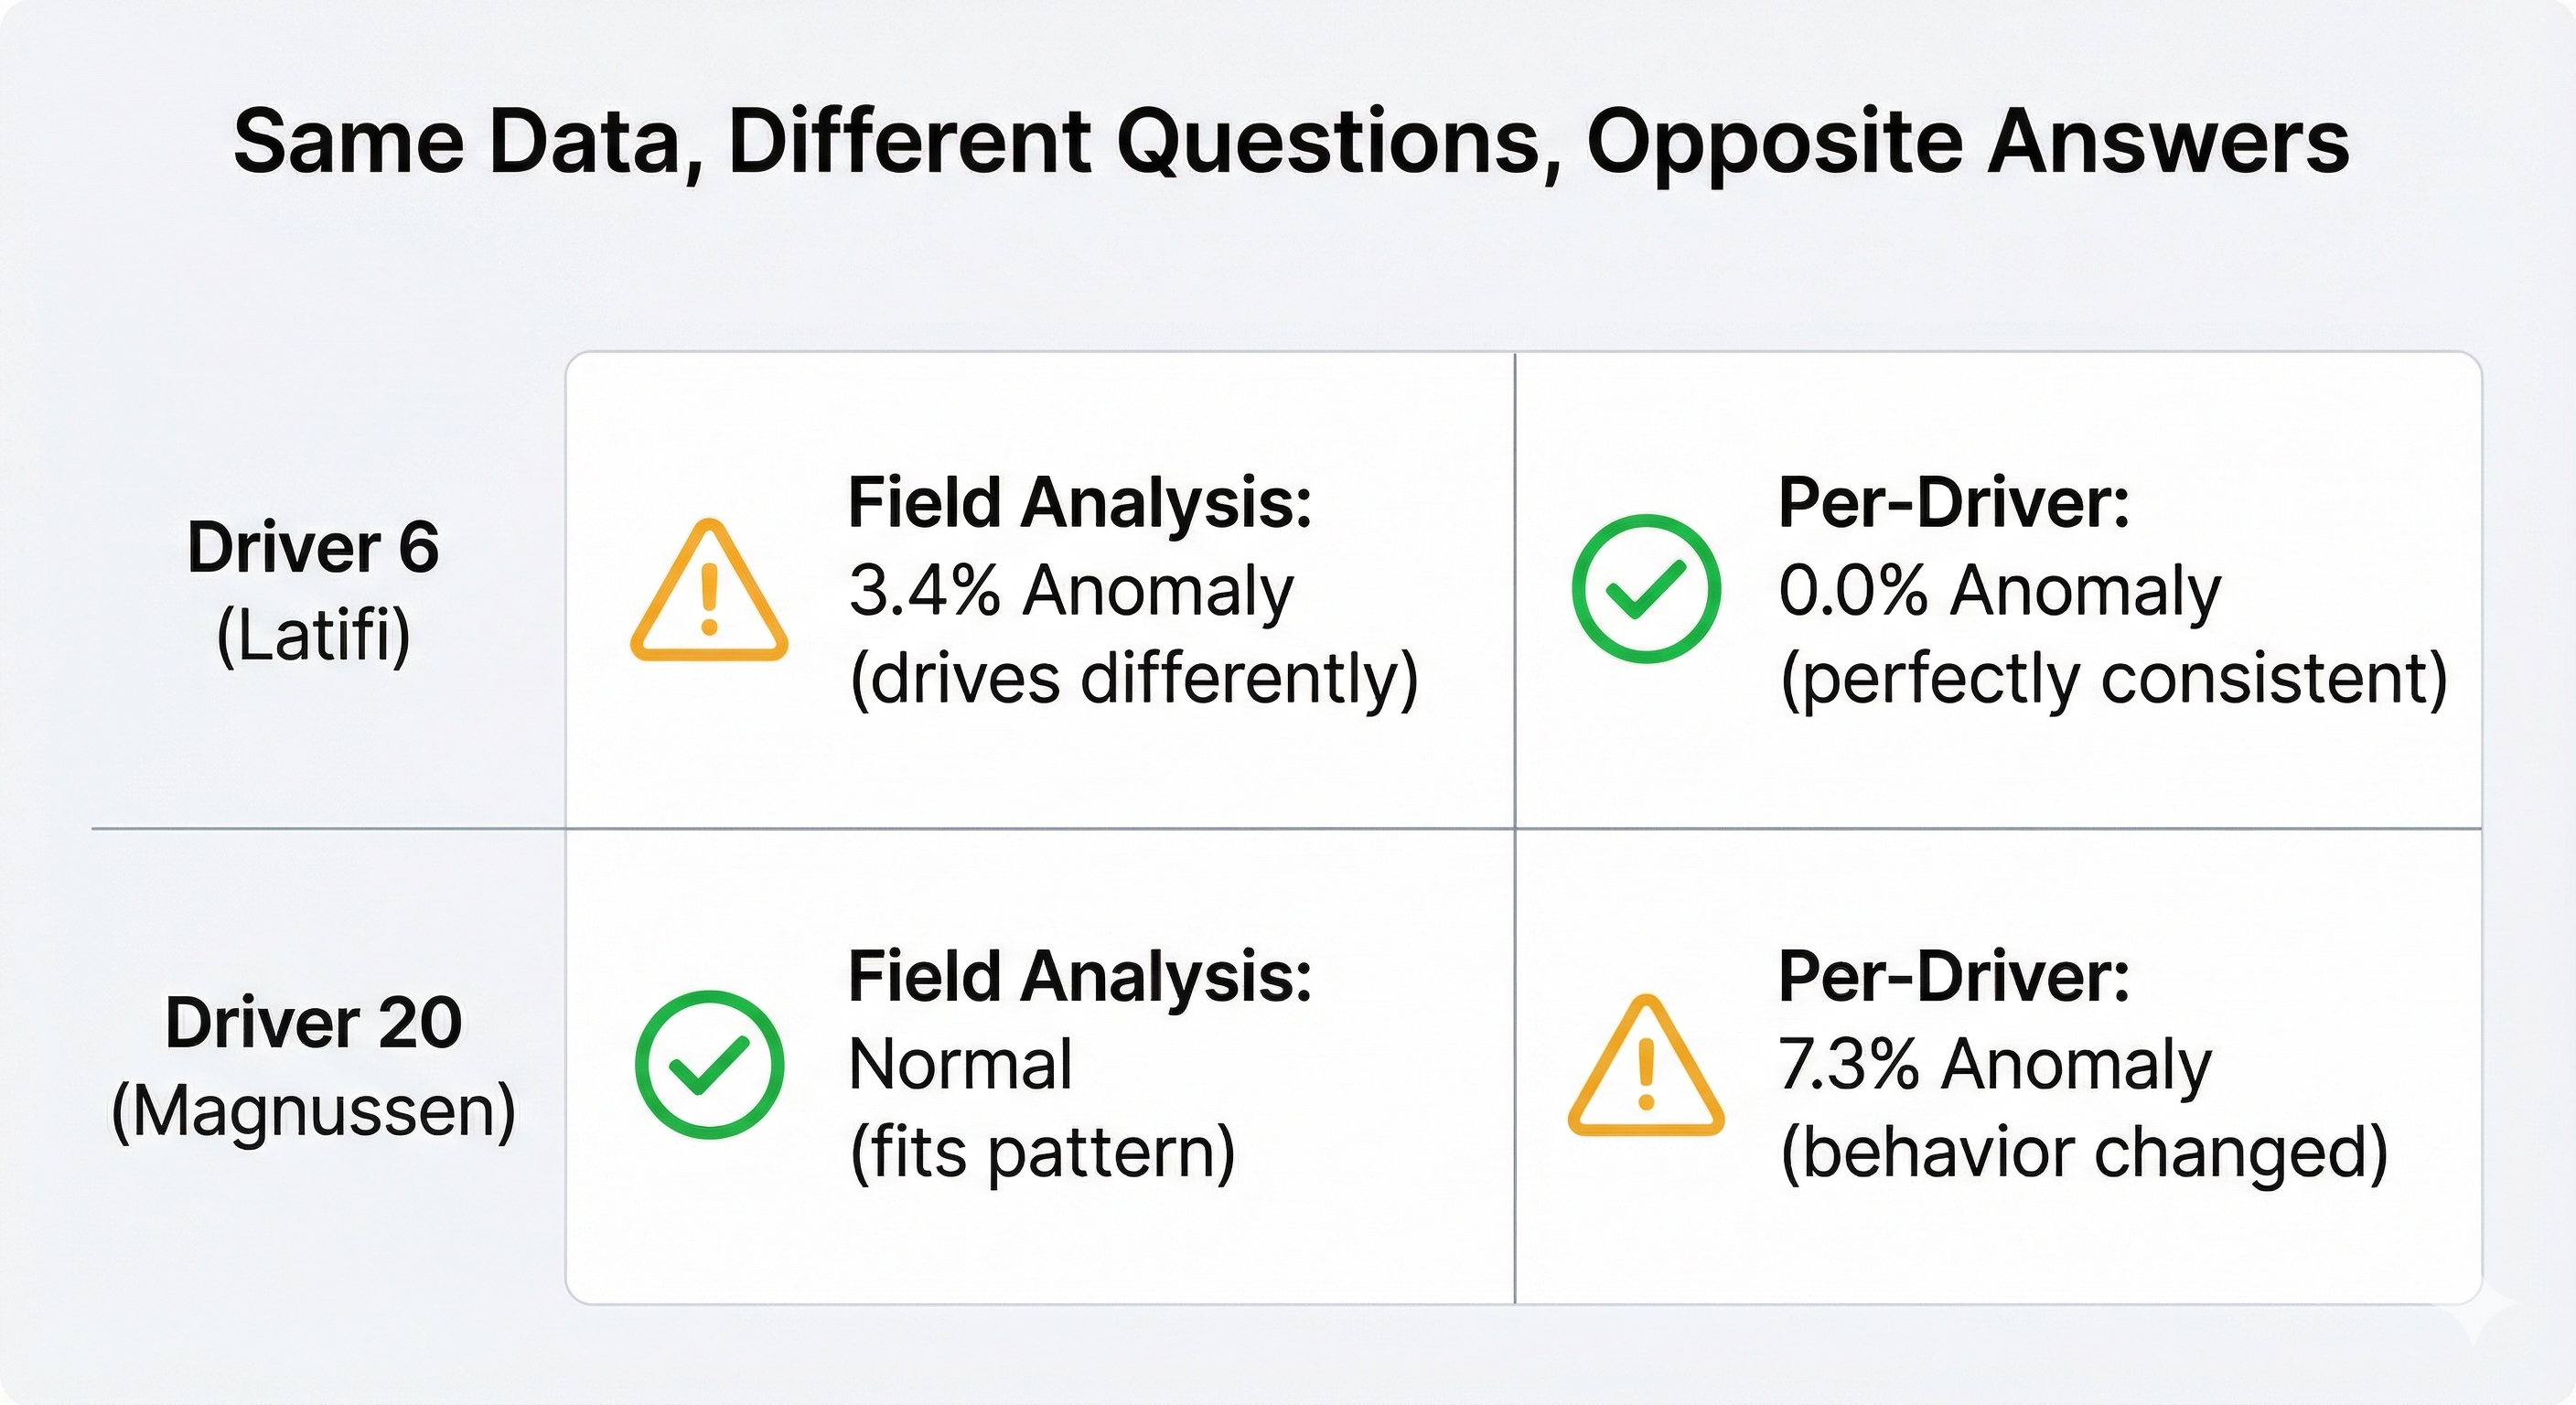
| Driver | Pass 1: Self-Anomaly | Pass 2: Fleet Divergence | Interpretation |
|---|---|---|---|
| 6 (Latifi) | 0% | 30% | Consistent BUT different |
| 44 (Hamilton) | Low | 20% | Unique behavioral style |
| 14 (Alonso) | Low | 0% | Behaviorally aligned with fleet |
| 20 (Magnussen) | 7.3% | 0% | Changed behavior, but within fleet pattern |
Latifi drove the same way all race (0% self-anomaly)
but that way was unlike how other drivers behaved (30% fleet divergence)
This is exactly the insight neither single-pass approach can provide.
The High-Dimensional Opportunity
This analysis used 48 dimensions from public timing data. Triaxis AI is designed to process 500-1,000+ dimensional feature spaces at real-time speeds.
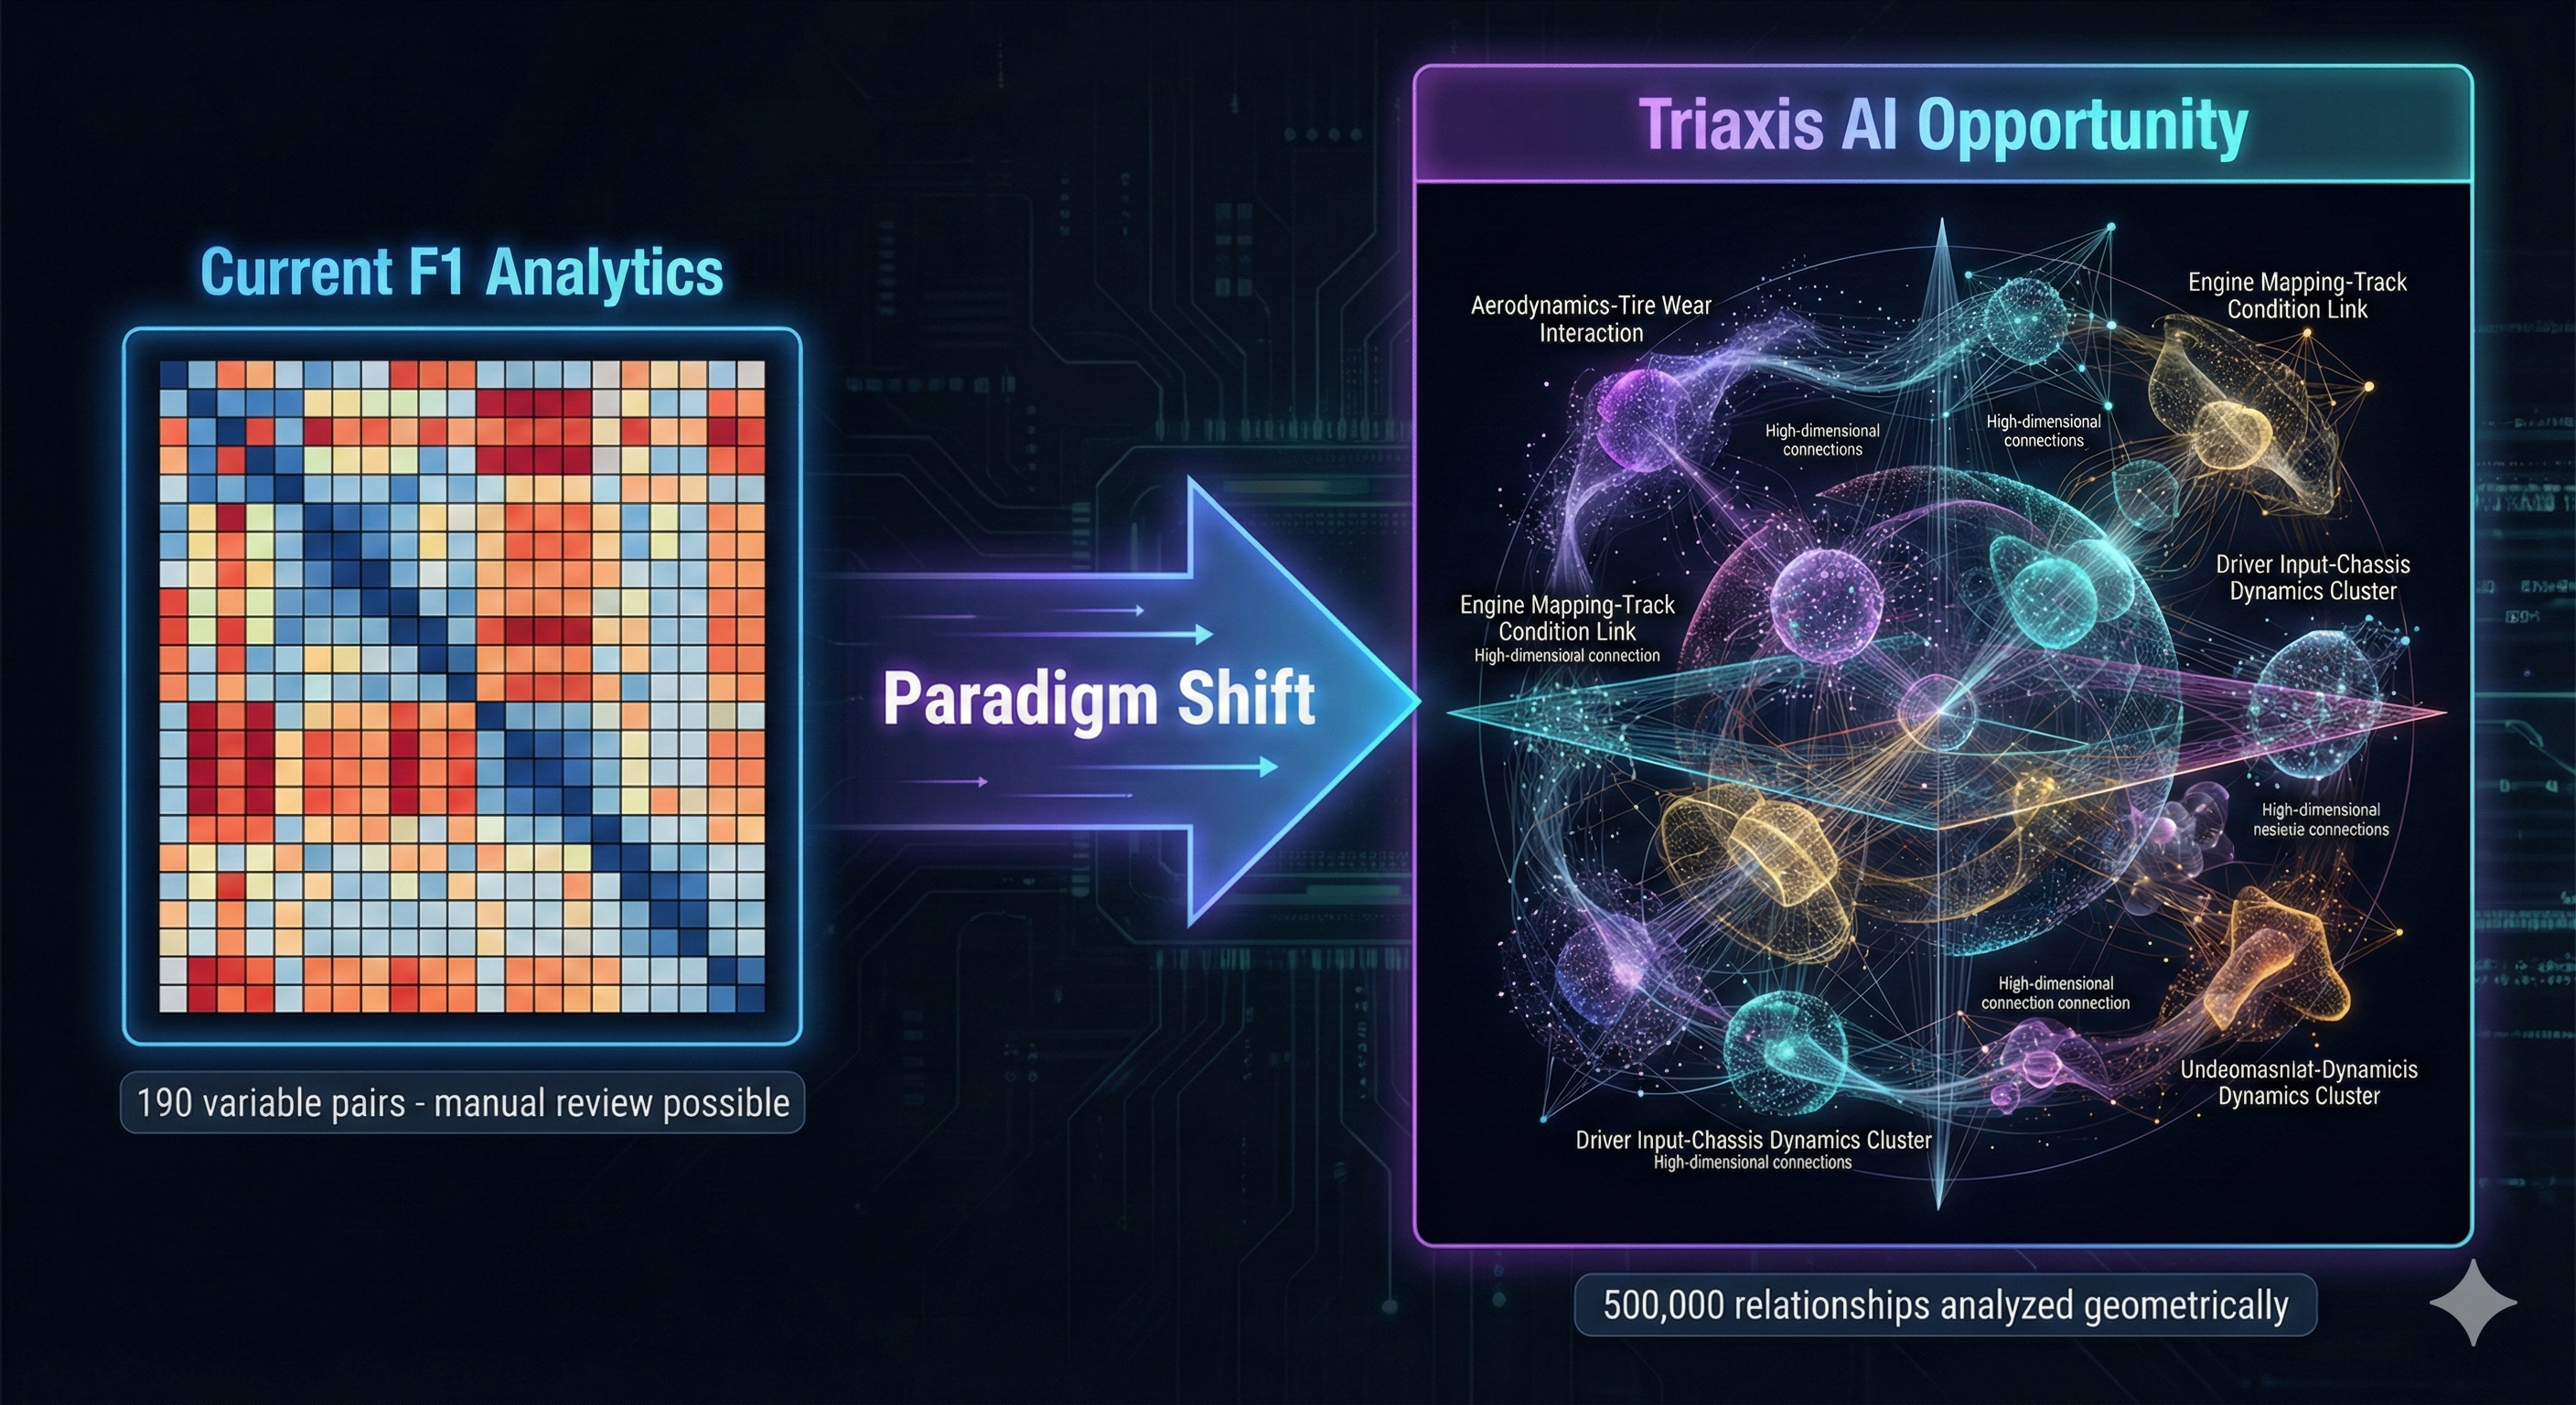
Traditional Correlation Methods
- -Limited to ~20 variables at a time
- -500x500 = 124,750 pairs (impossible to review)
- -Must pre-select which variables to analyze
Triaxis AI Cosine Geometry
- +500-1,000+ dimensions simultaneously
- +Discovers relationships geometrically
- +Real-time at 9,731+ samples/second
The Autonomous Vehicle Opportunity
For autonomous fleets, this architecture becomes even more powerful because the driver-vs-vehicle ambiguity disappears entirely. Every behavioral anomaly is directly actionable as a system issue.
Human-Driven Analysis
- ?Anomaly = driver OR vehicle issue?
- ?Root cause ambiguous
- ?Behavior varies by driver
Autonomous Fleet Analysis
- Anomaly = always system
- Root cause is actionable
- Algorithm should be consistent
Critical Autonomous Fleet Use Cases
| Pass | Detection | Meaning | Urgency |
|---|---|---|---|
| 1 | Single AV drifts from baseline | Sensor degradation, calibration drift | Maintenance |
| 1 | Sudden behavior change | Software glitch, edge case | Investigation |
| 2 | One AV diverges from fleet | Individual hardware issue | Pull for service |
| 2 | Multiple AVs shift together | Software bug / OTA issue | CRITICAL |
| 2 | Unexpected cohort forms | Environmental factor | Analyze |
Why This Matters for AV Safety
Did the software update change fleet behavior? Which vehicles adapted differently?
Per-vehicle baseline drift reveals calibration issues before failure
AVs in novel scenarios show anomalous behavior - learning opportunities before incidents
Demonstrate continuous behavioral monitoring to NHTSA/regulators
Beyond Racing: Fleet Applications
The two-pass architecture generalizes directly to any fleet where individual AND peer behavior patterns matter:
Trucking/Logistics
"Is this truck behaving unusually vs. similar trucks on similar routes?"
Rail Operations
"Is this locomotive's behavioral pattern diverging from fleet peers?"
Industrial Robotics
"Is this robot's operational signature drifting from its cohort?"
Industrial IoT
"Are these machines forming unexpected behavioral clusters?"
The common architecture: Pass 1 asks "Is this entity unusual for ITSELF?" while Pass 2 asks "Is this entity unusual relative to PEERS?"
Key Takeaways
Adding context REVEALS anomalies, not explains them away
Mode B found 3x more anomalies than Mode A. Behaviors that looked "normal" were actually contextually inappropriate - the core discovery of this research.
Two passes answer complementary questions
Pass 1: "Is this entity unusual for THEMSELVES?" Pass 2: "Is this entity unusual relative to PEERS given their situation?" Neither alone tells the full story.
Context exposes hidden fleet-wide shifts
Mode B detected 4 global regime changes vs Mode A's 1 - moments when many drivers were behaving unusually FOR THEIR SITUATION, not just unusually in absolute terms.
Autonomous fleets eliminate driver ambiguity
Every anomaly becomes directly actionable as a system issue - enabling OTA validation, sensor monitoring, and regulatory compliance at scale.
Ready to Explore Two-Pass Fleet Analysis?
Contact us to discuss how the two-pass architecture could apply to your fleet - whether autonomous vehicles, trucking, rail, or industrial equipment.